SchemaCrawler Database Diagramming
SchemaCrawler generates database diagrams using Graphviz in any of the output formats supported by Graphviz. SchemaCrawler is unique among database diagramming tools in that you do not need to know the table names or column names that you are interested in. All you need to know is what to search for, in the form of a regular expression. You can filter out tables, views, and columns based on regular expressions, using grep functionality. SchemaCrawler has powerful command-line options to match tables, and then find other tables related to the matched ones, whether they are parent or child tables. If your schema changes, you can simply regenerate the diagram, without having to know the exact changes that were made to the schema.
SchemaCrawler relies on Graphviz to generate diagrams. Install Graphviz first, and ensure that it is on the system PATH. Then you can run SchemaCrawler with the correct command-line options - for example, --command=schema --output-format=png --output-file=graph.png
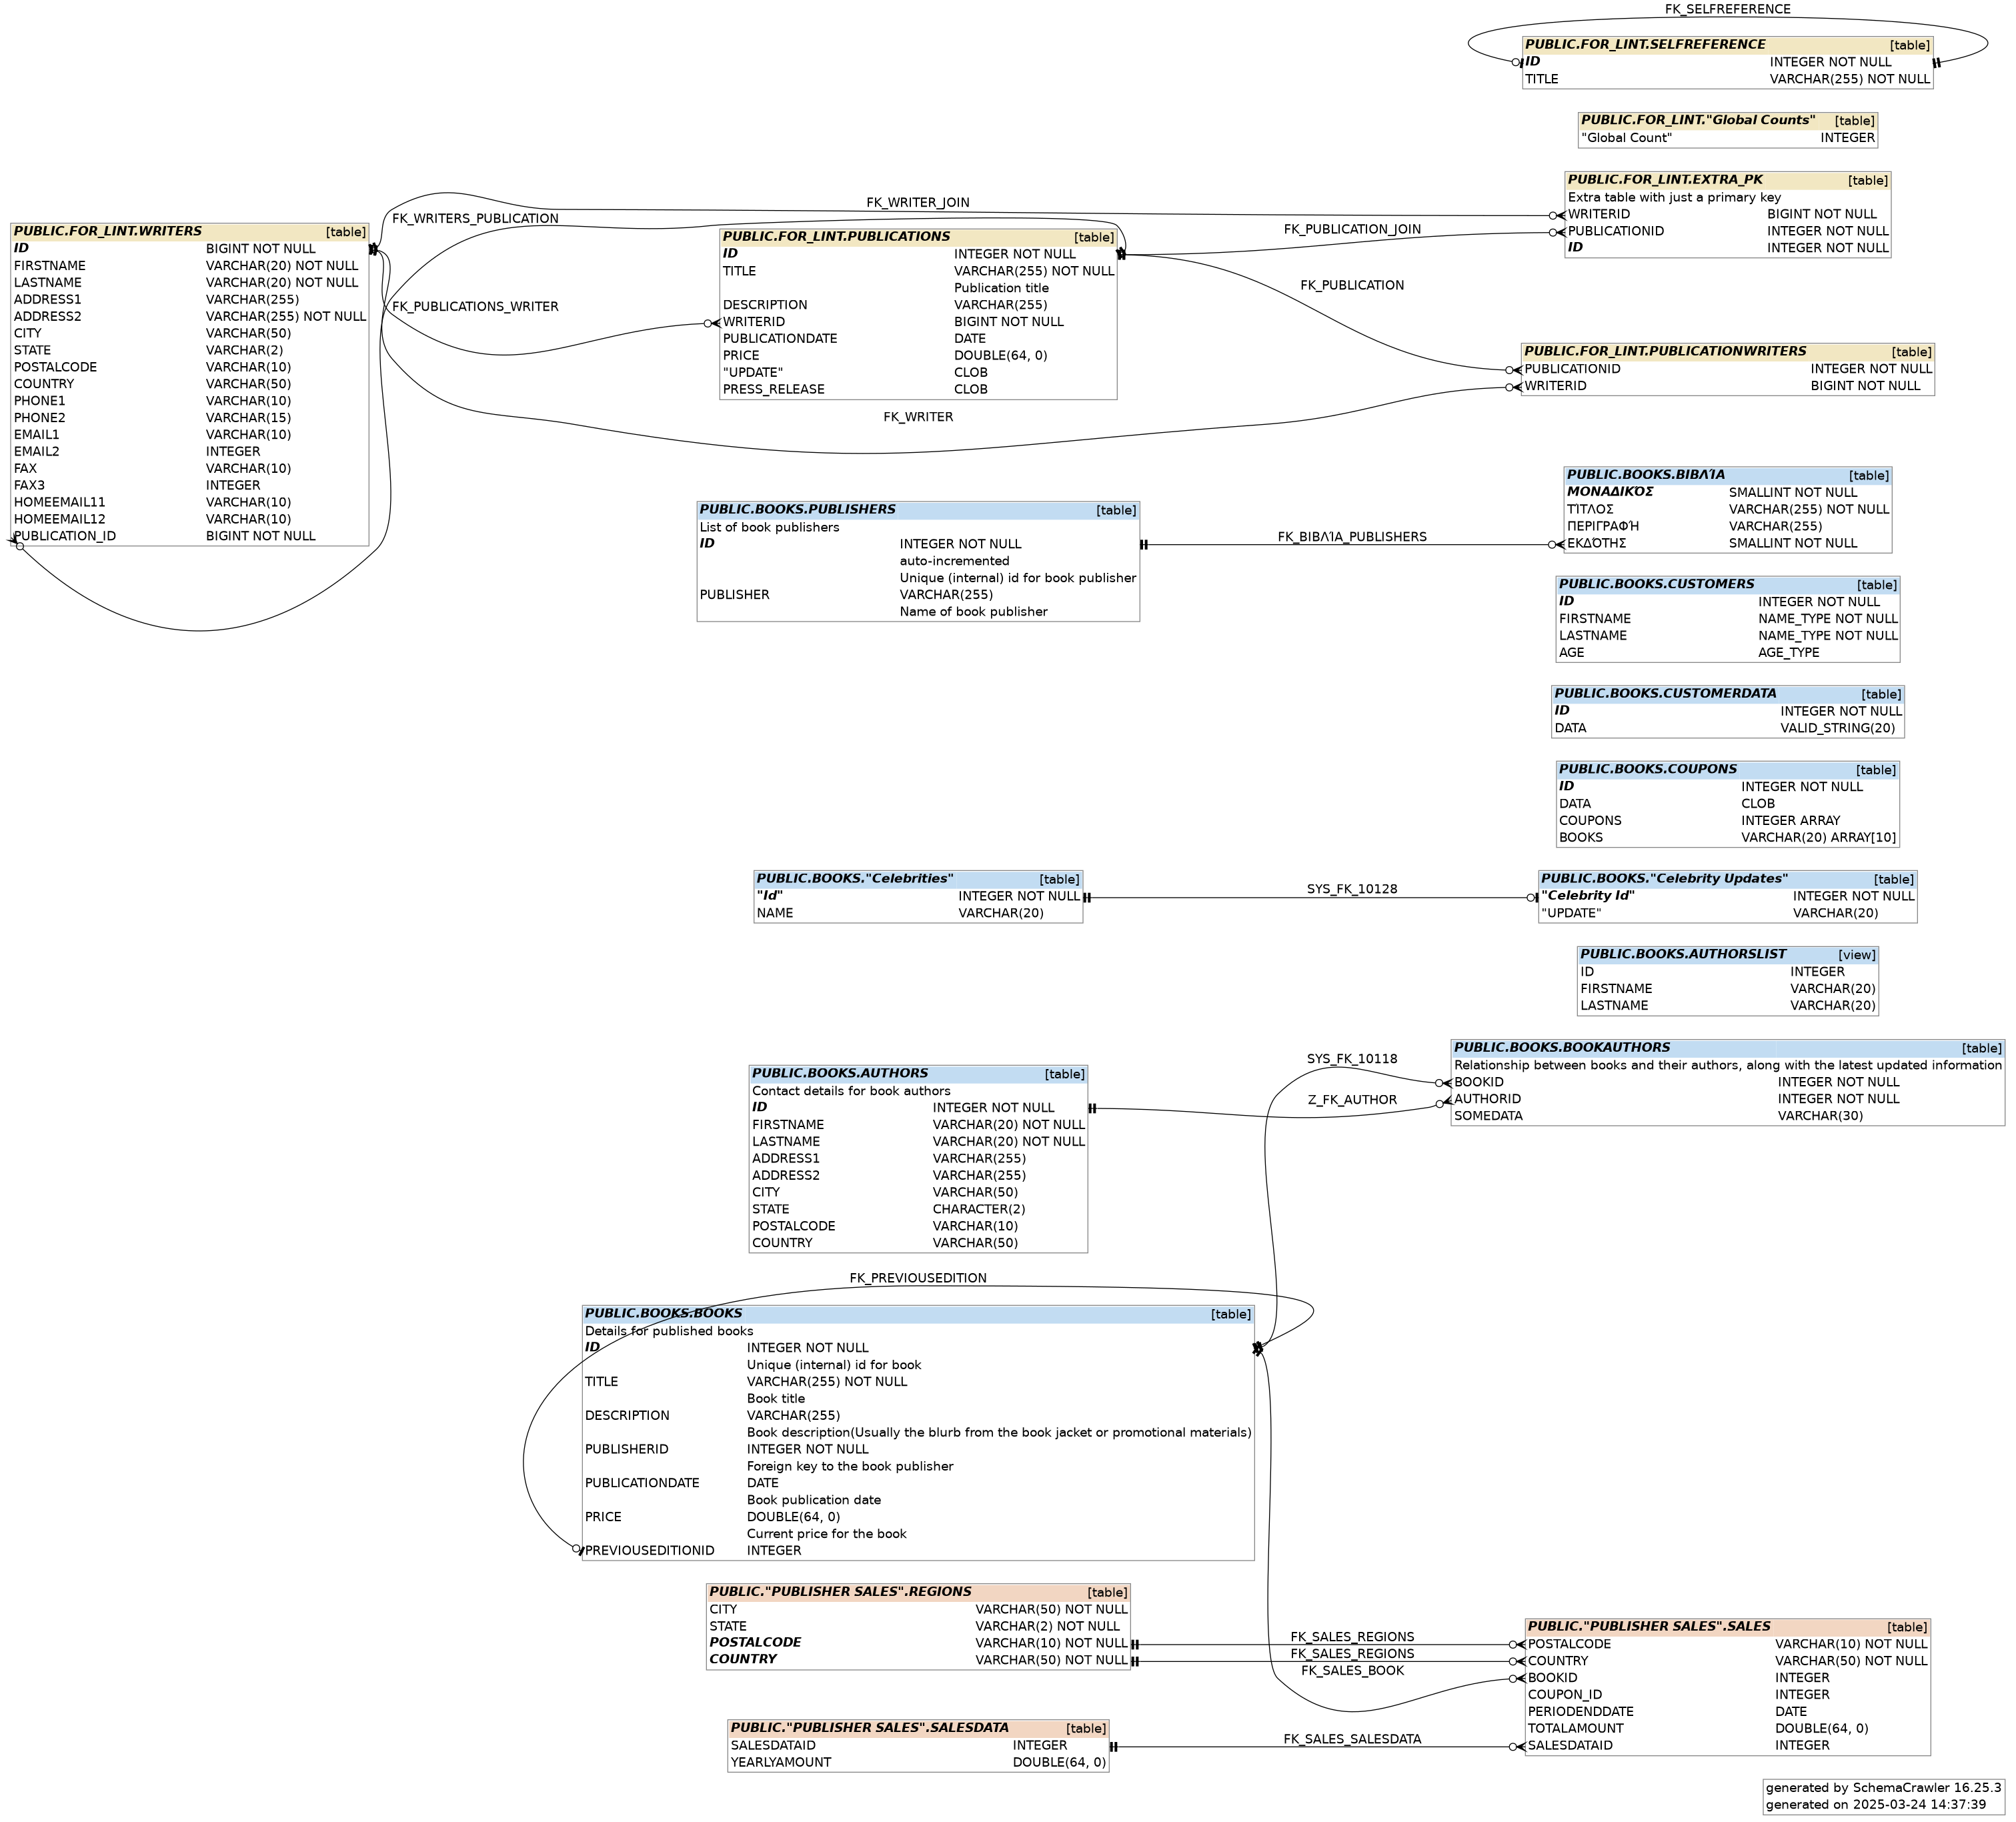
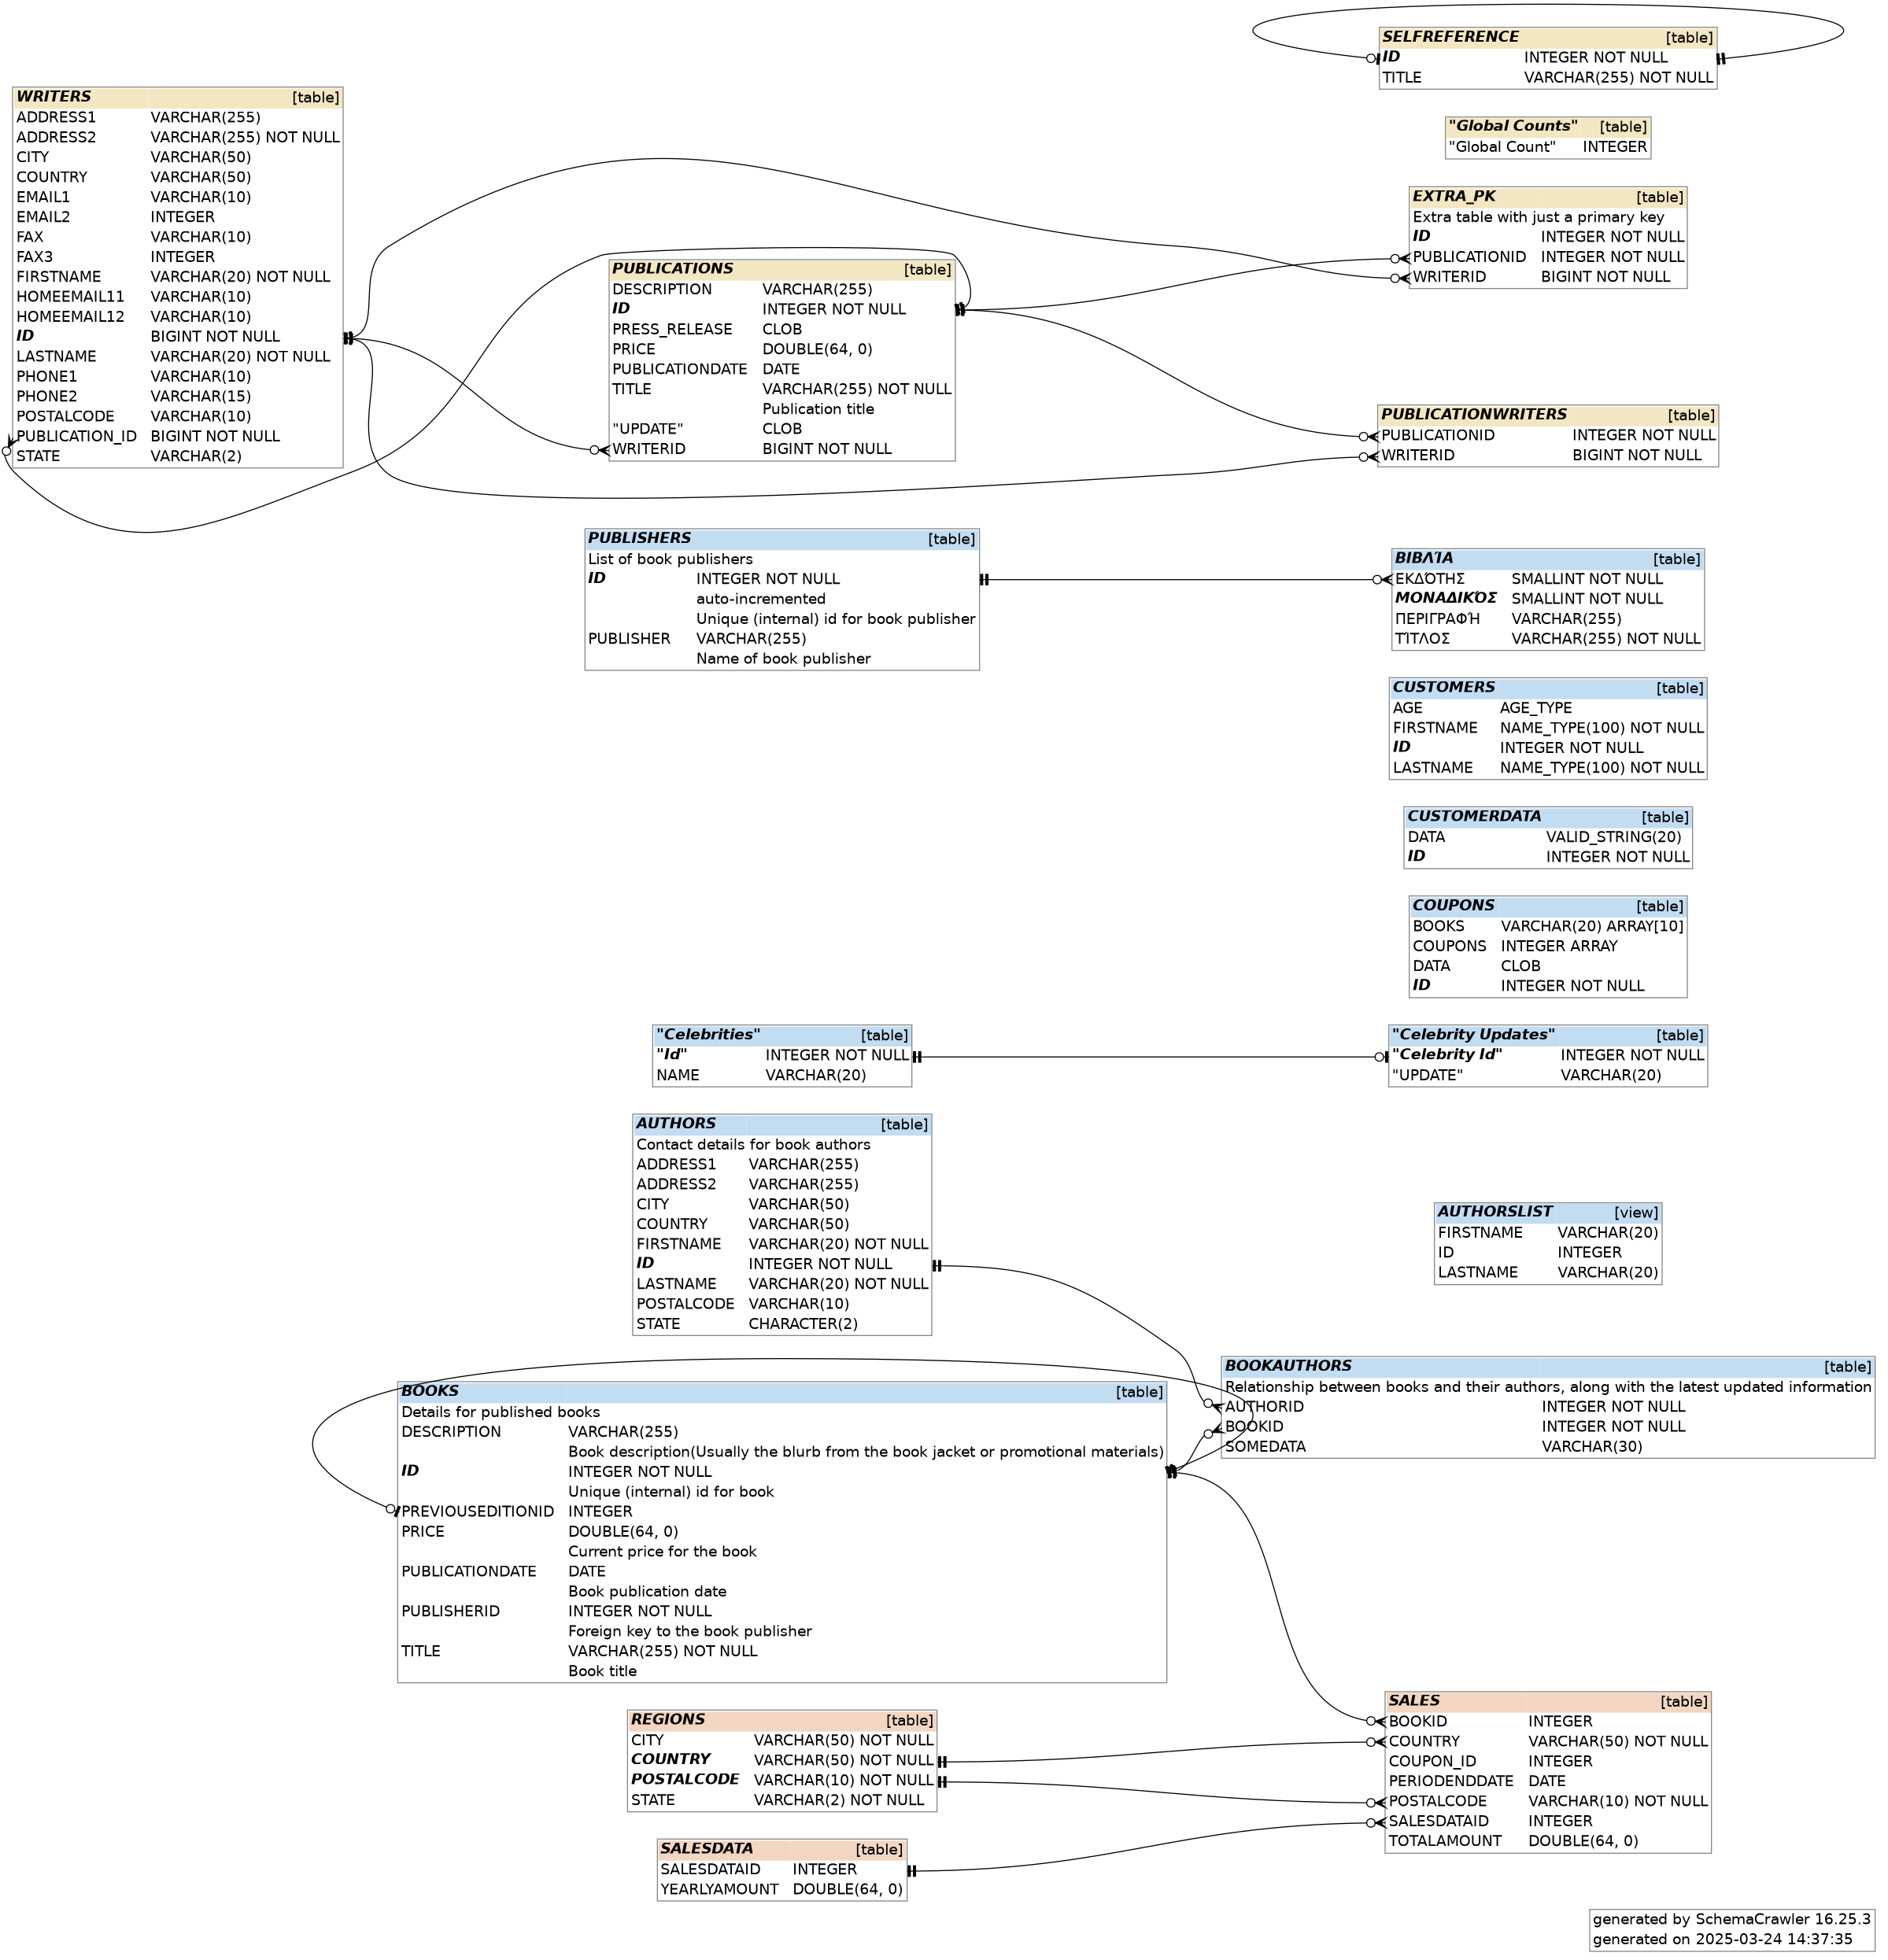
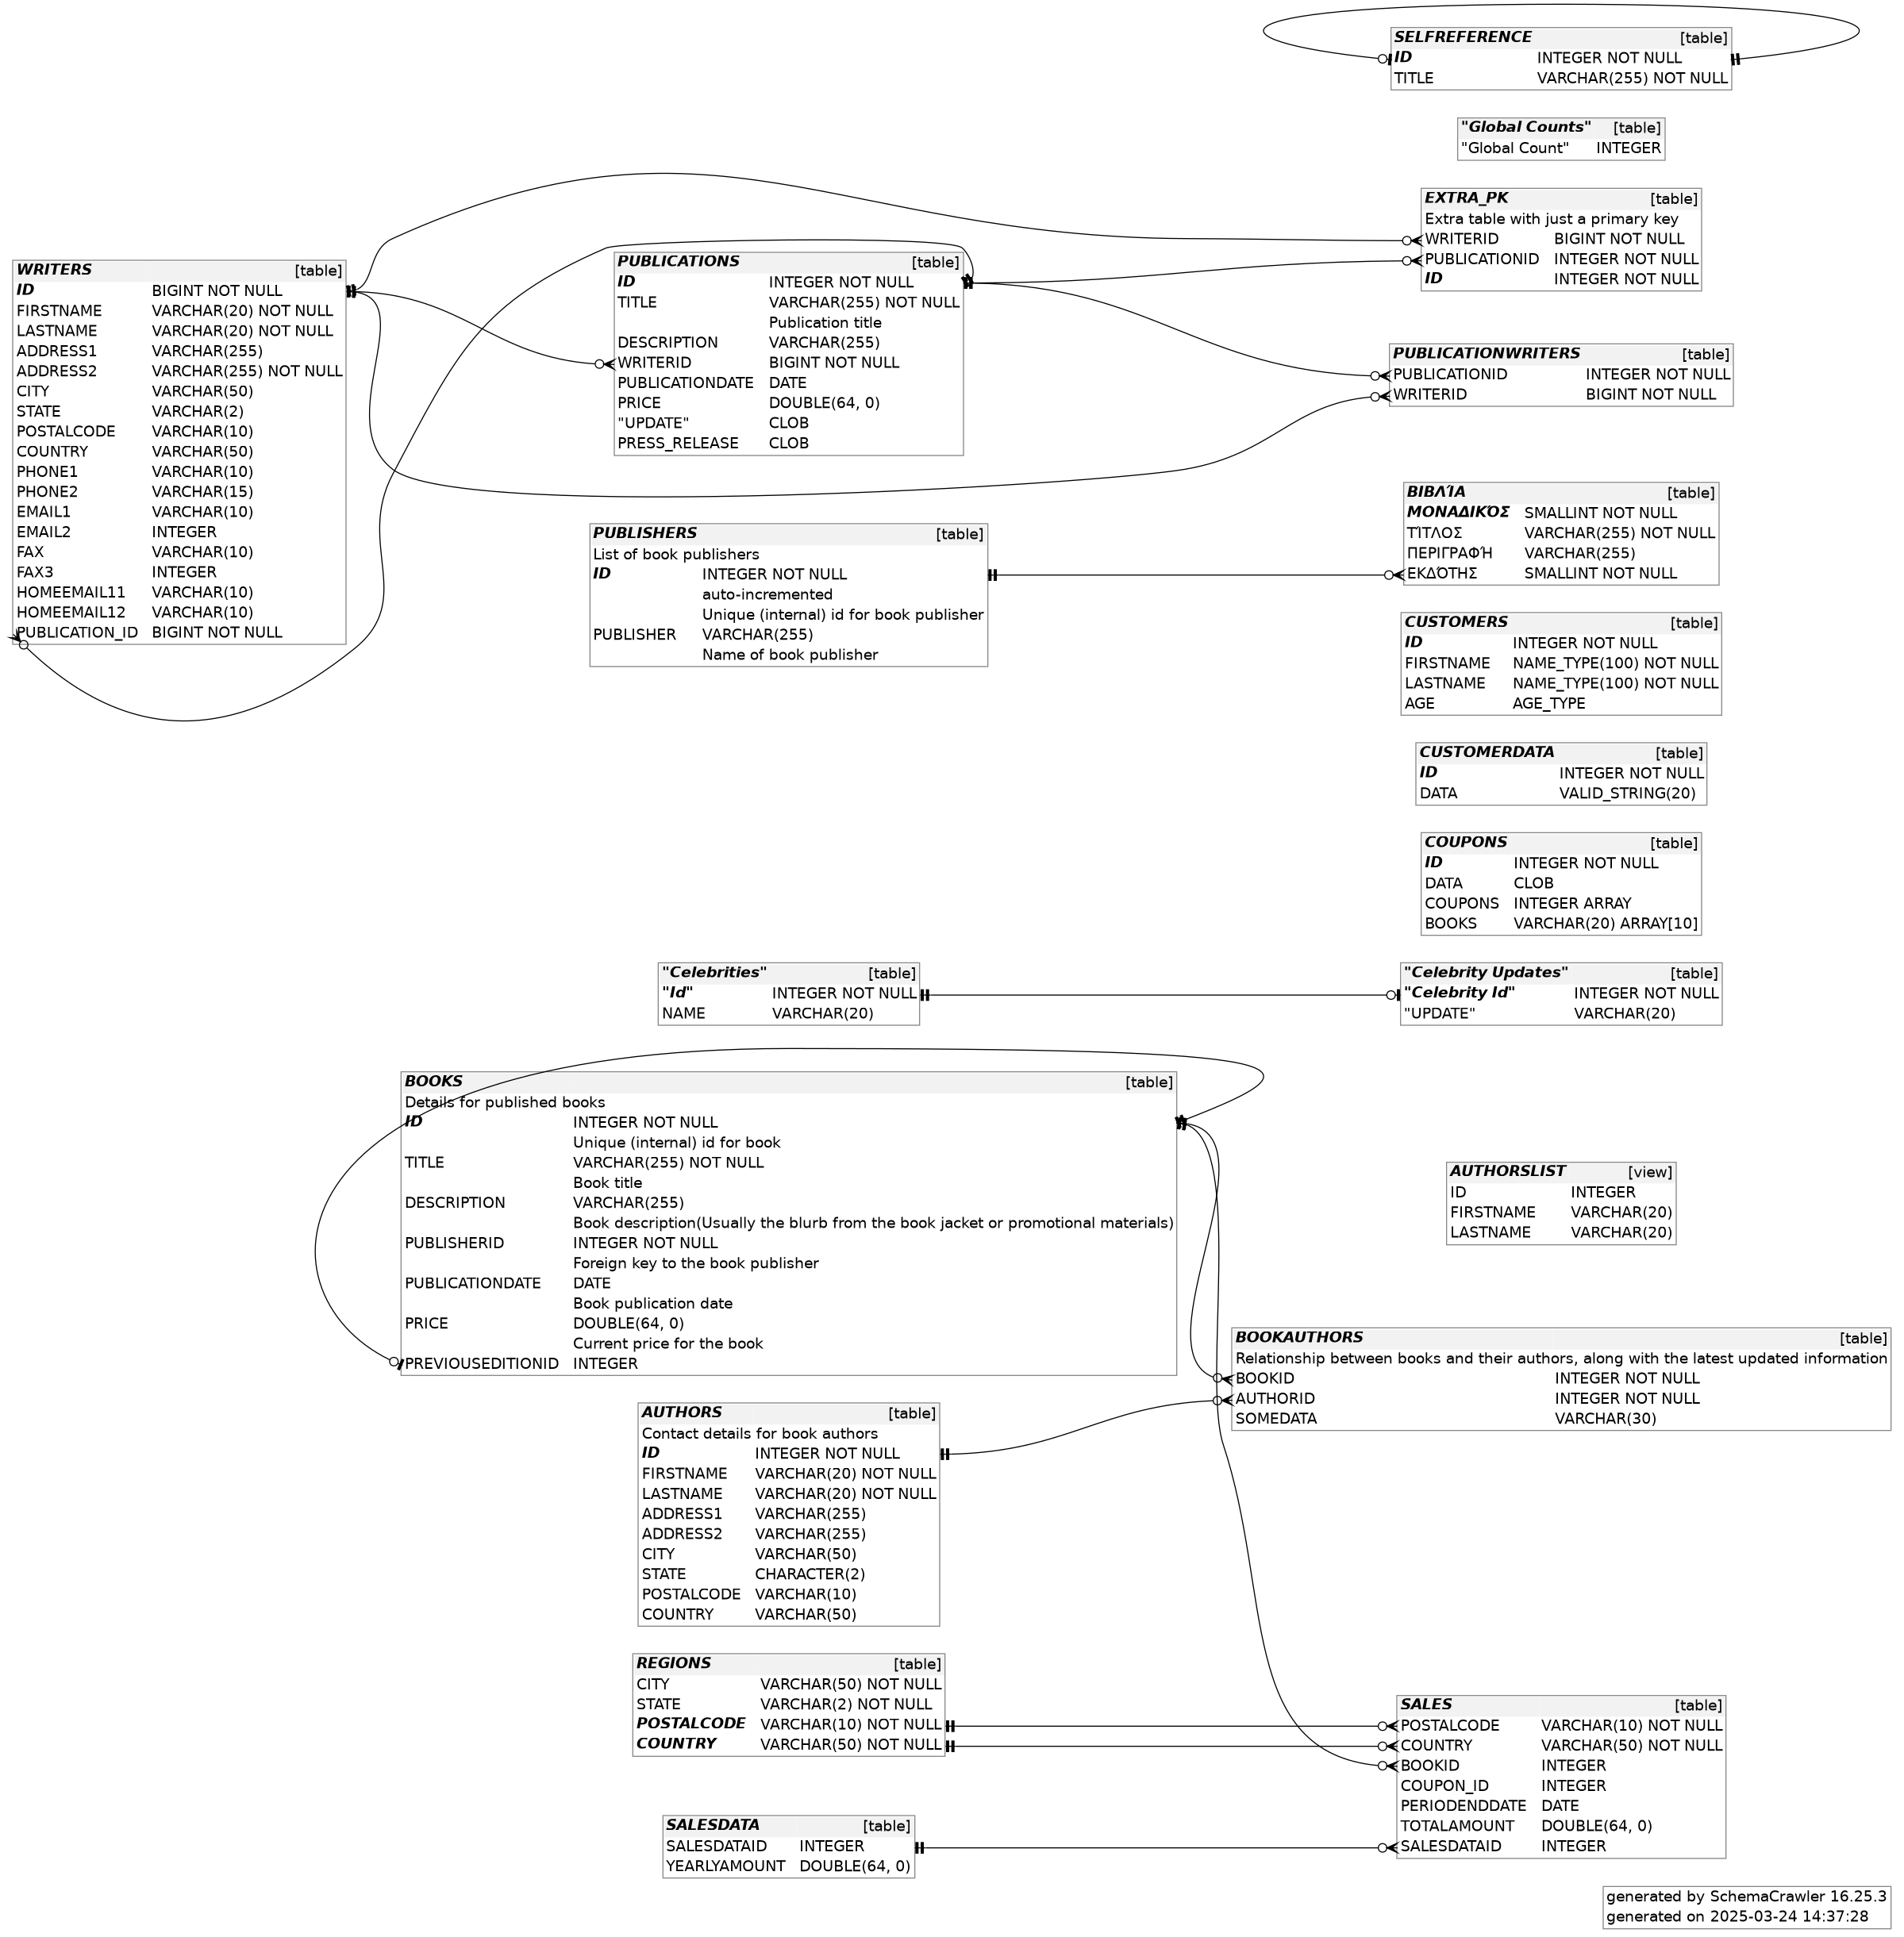
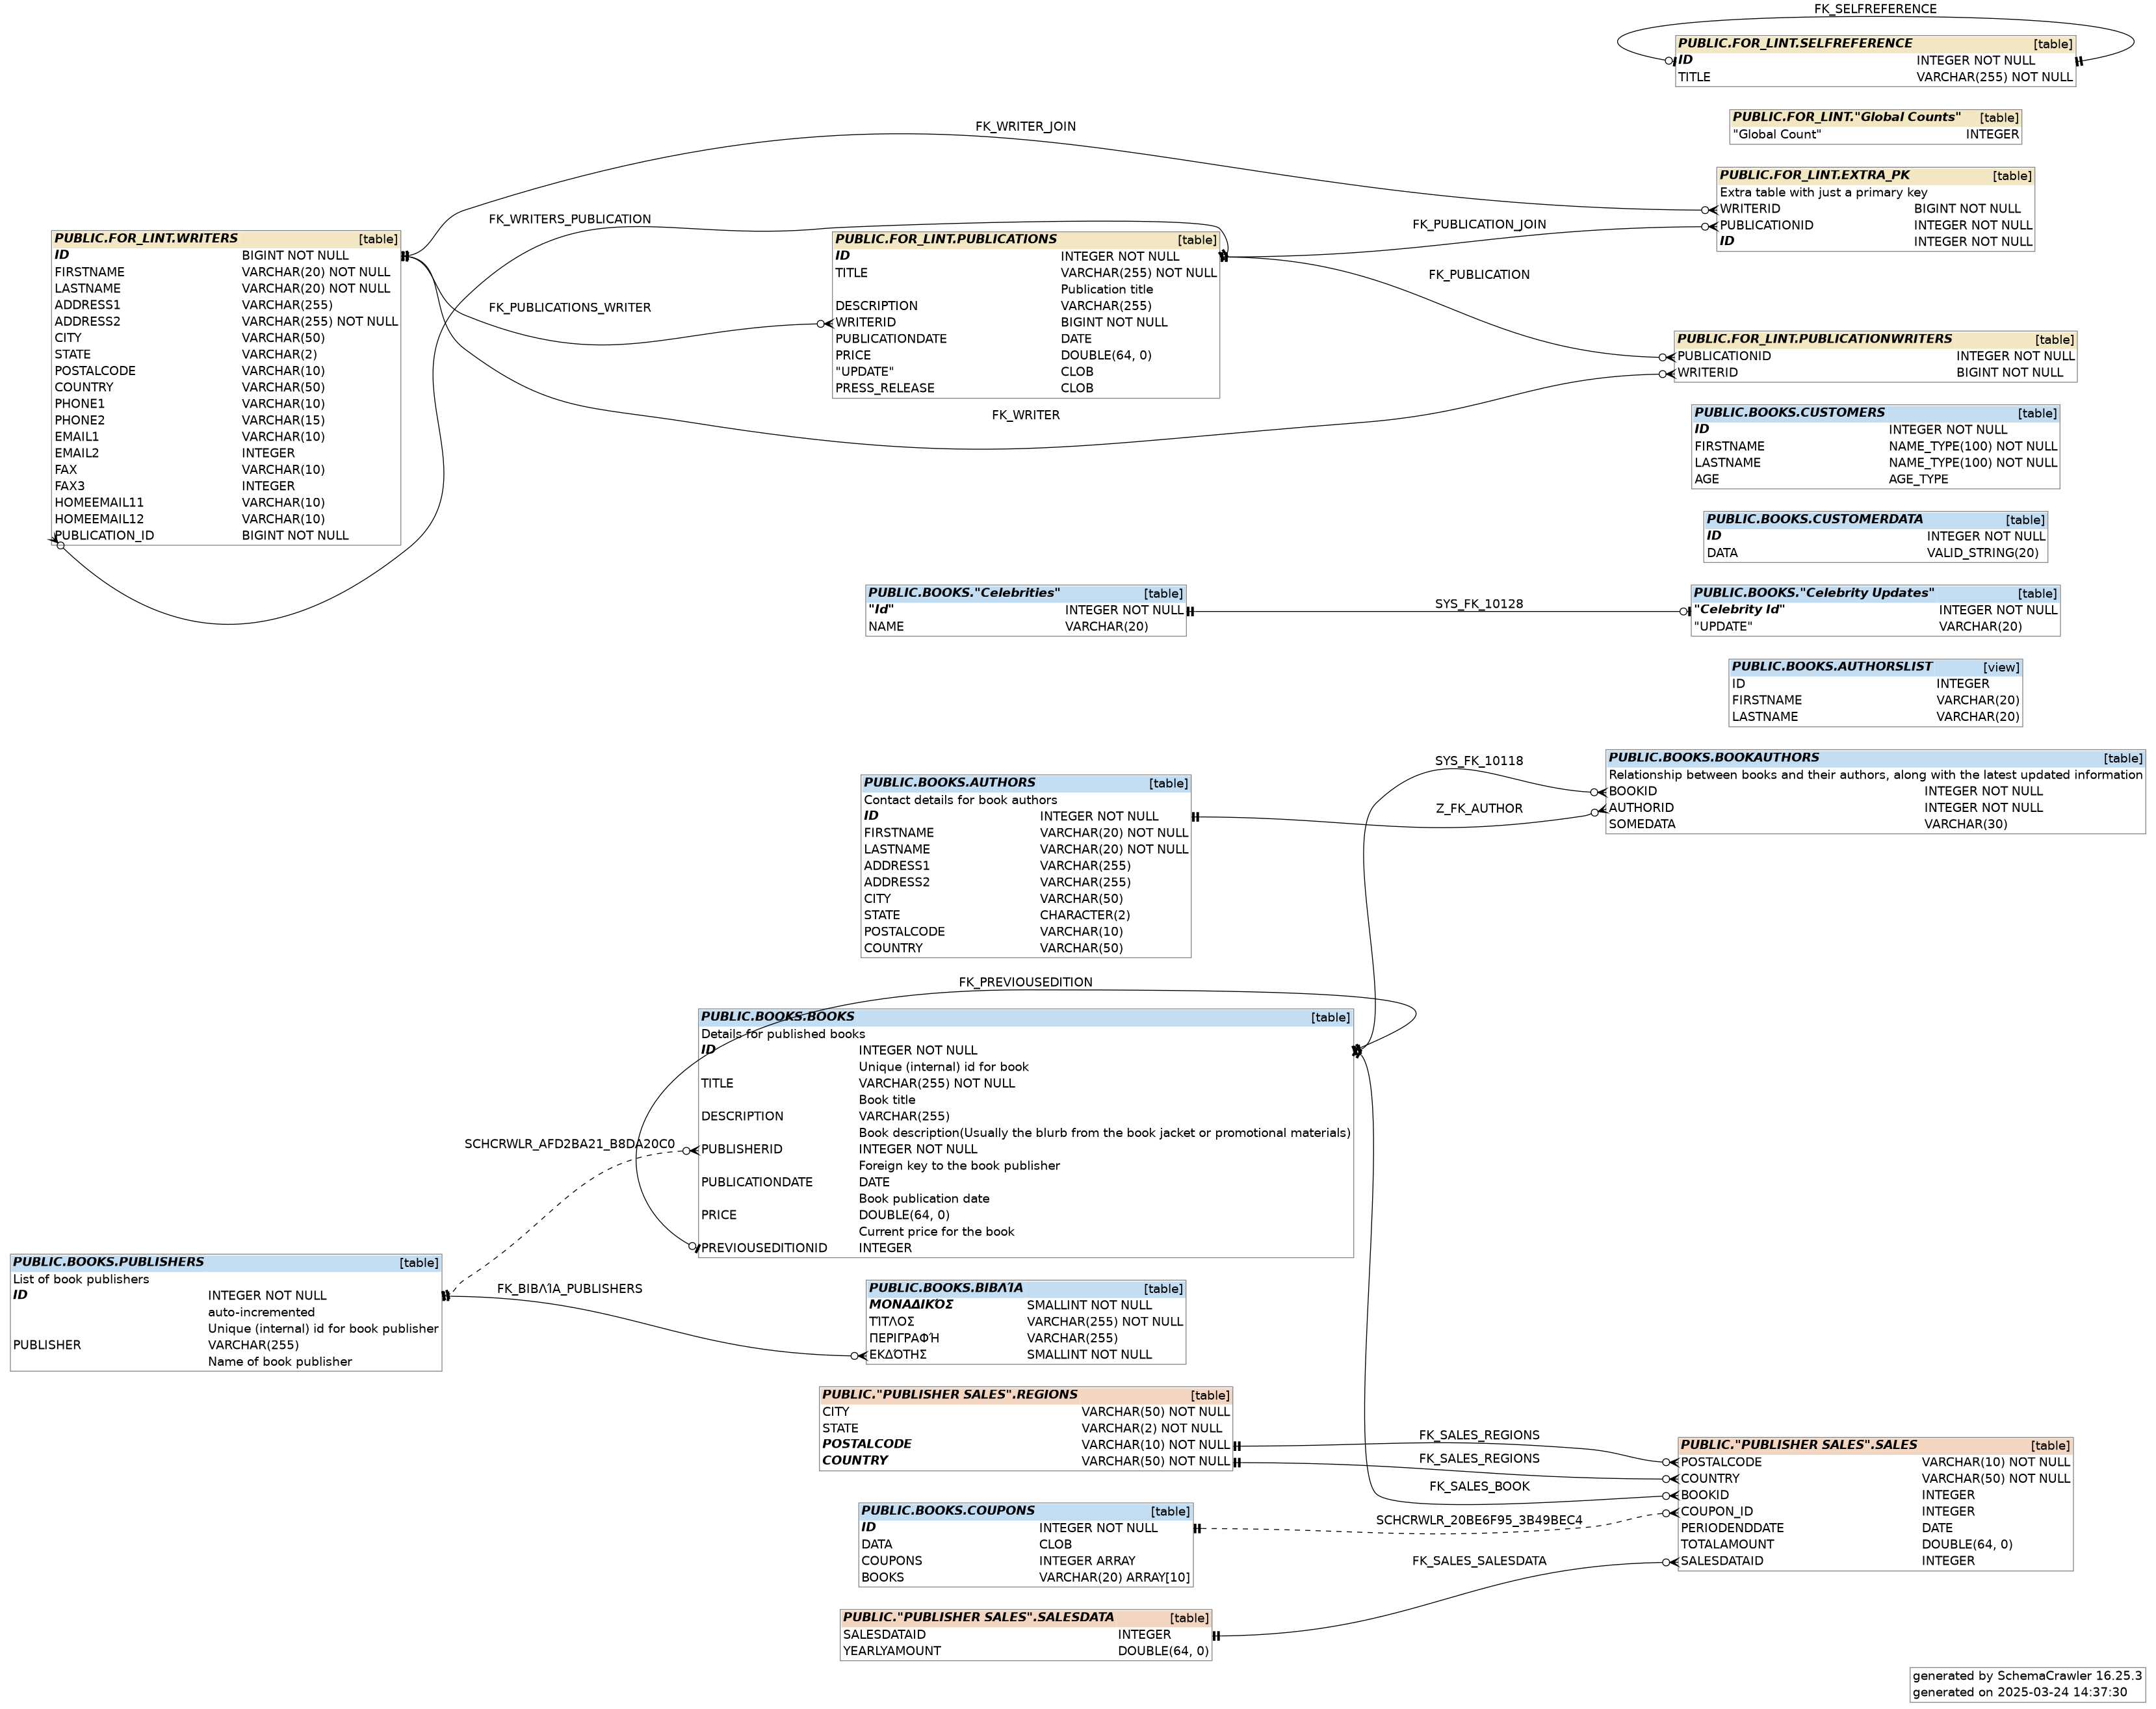
See the diagram example in the SchemaCrawler examples download. An example of a SchemaCrawler database diagram is below.
SchemaCrawler allows editing diagram via third-party applications. See below for how to generate Mermaid Entity Relationship Diagrams, PlantUML diagrams and dbdiagram.io diagrams from your database, which can then be further edited.
Database Diagram Options
SchemaCrawler offers several options to change what you see on the database diagram. Here are a few variations:
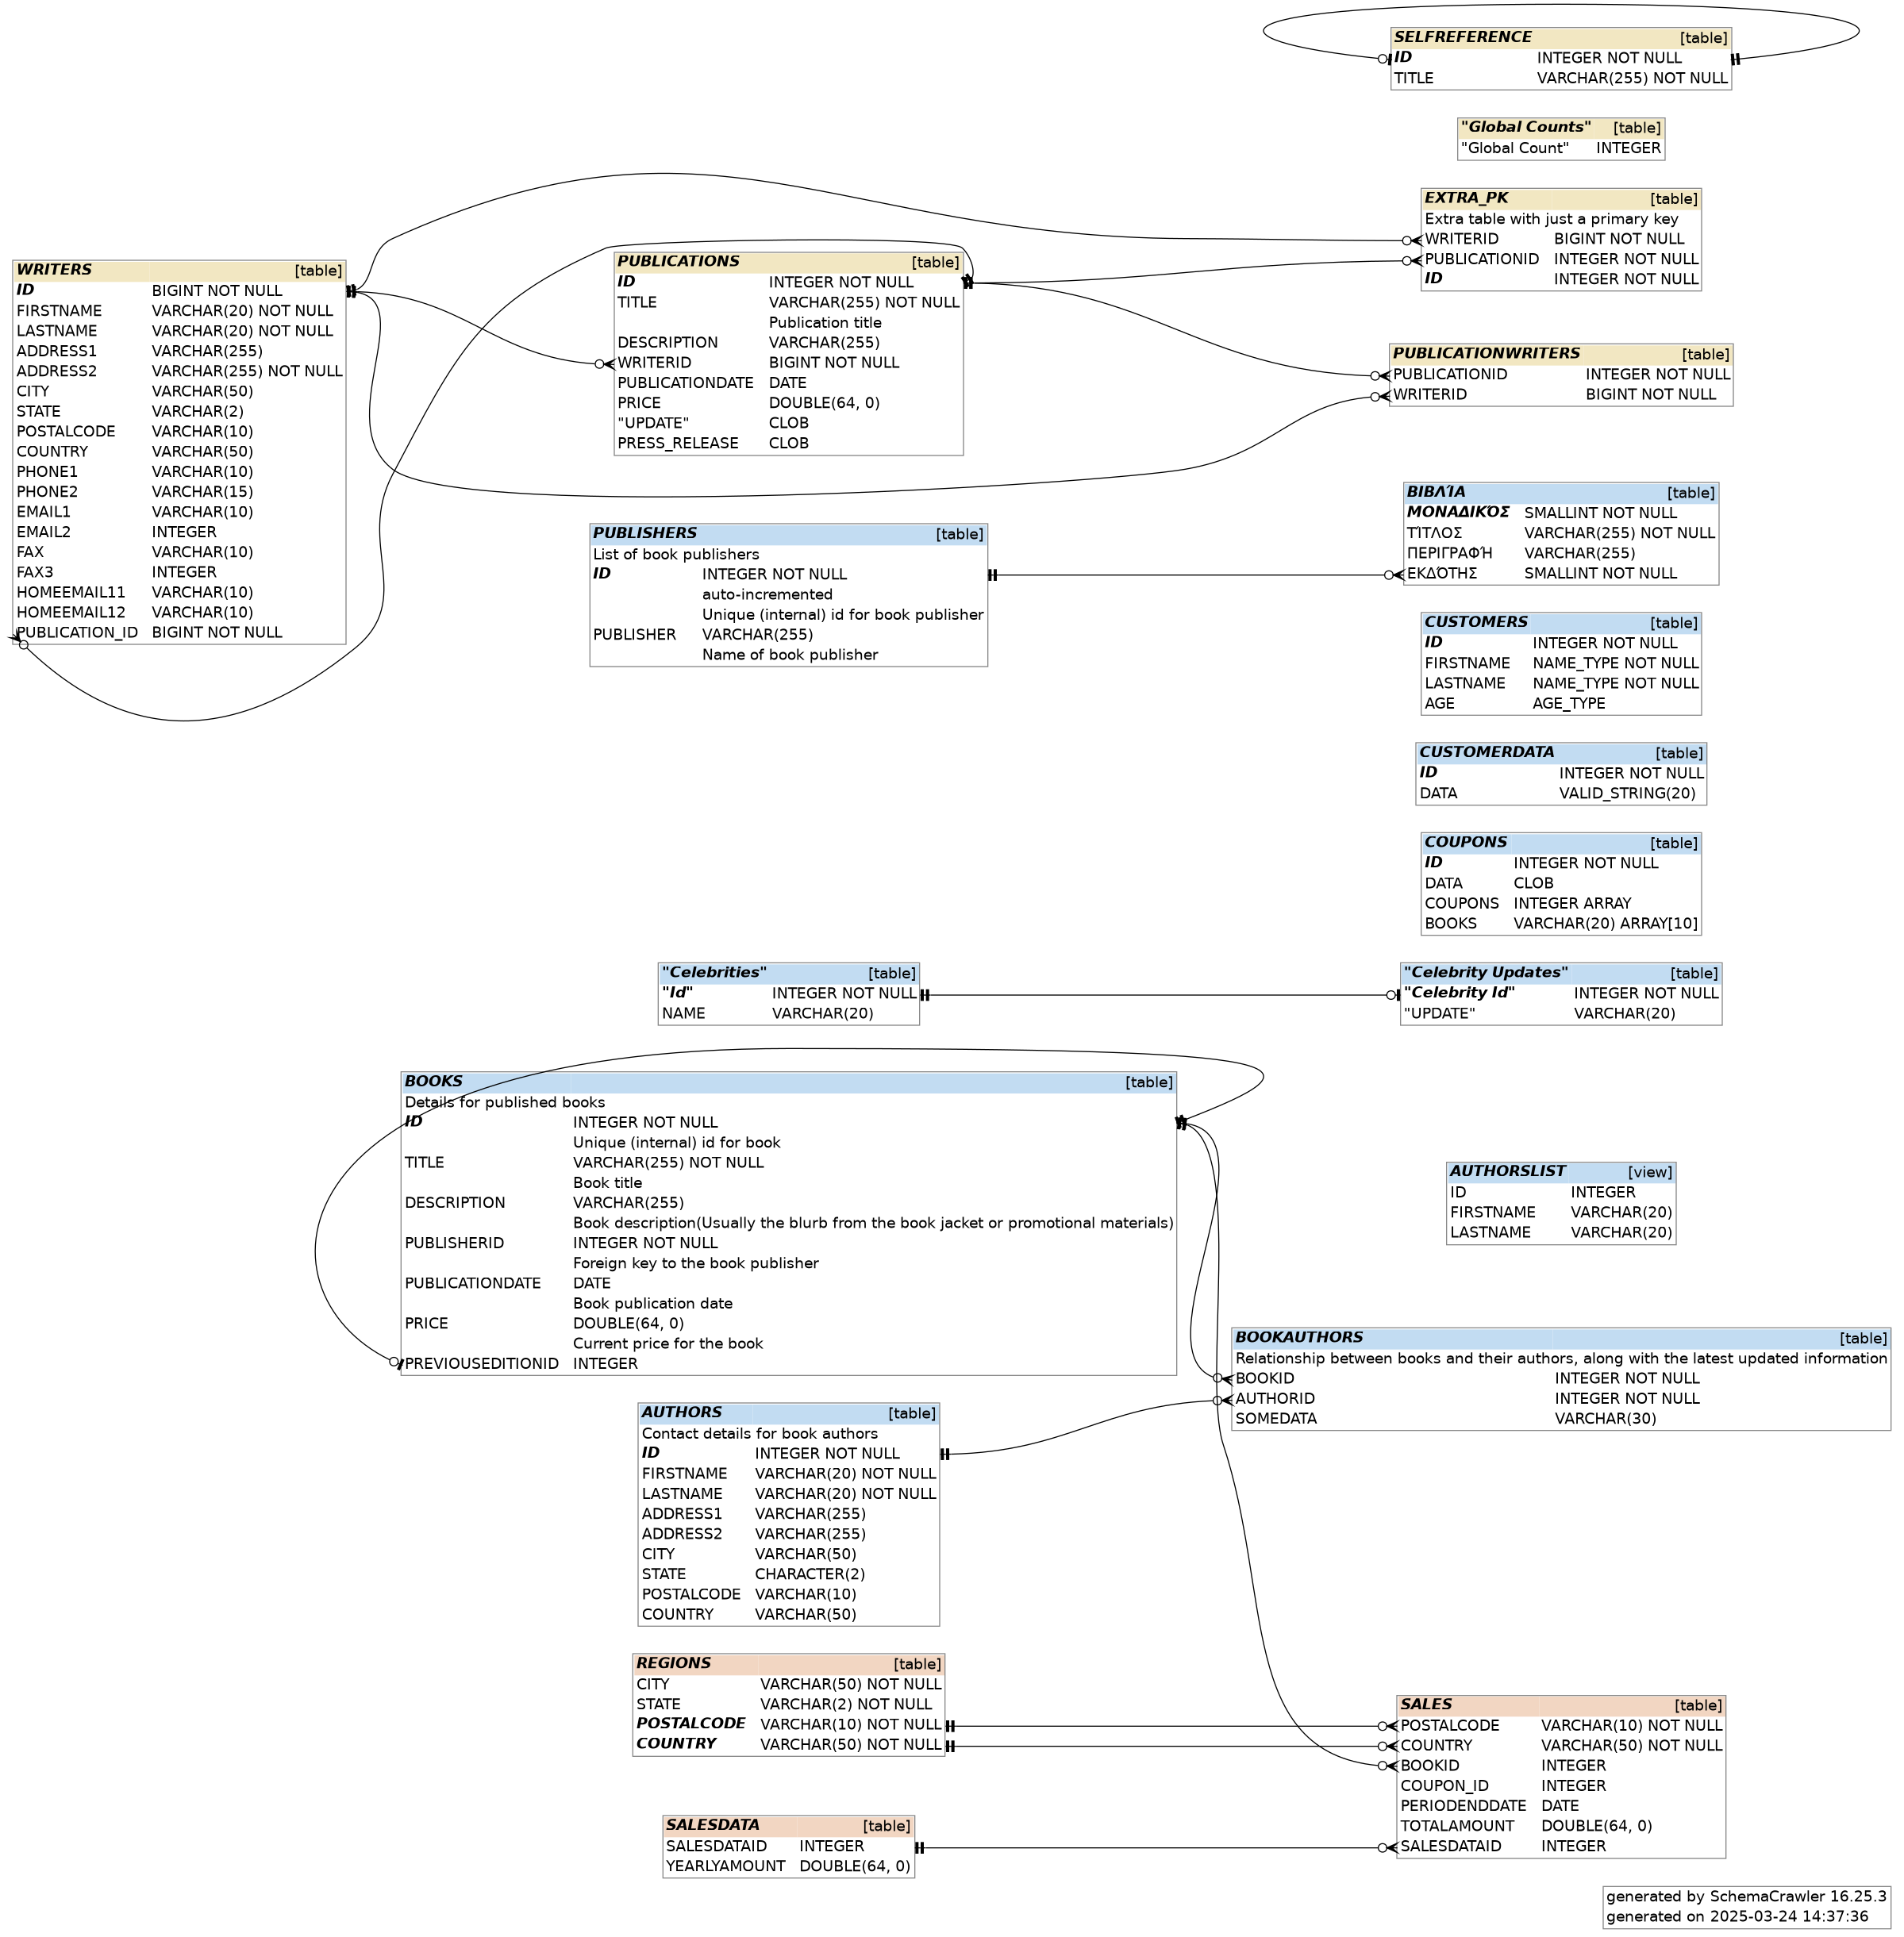
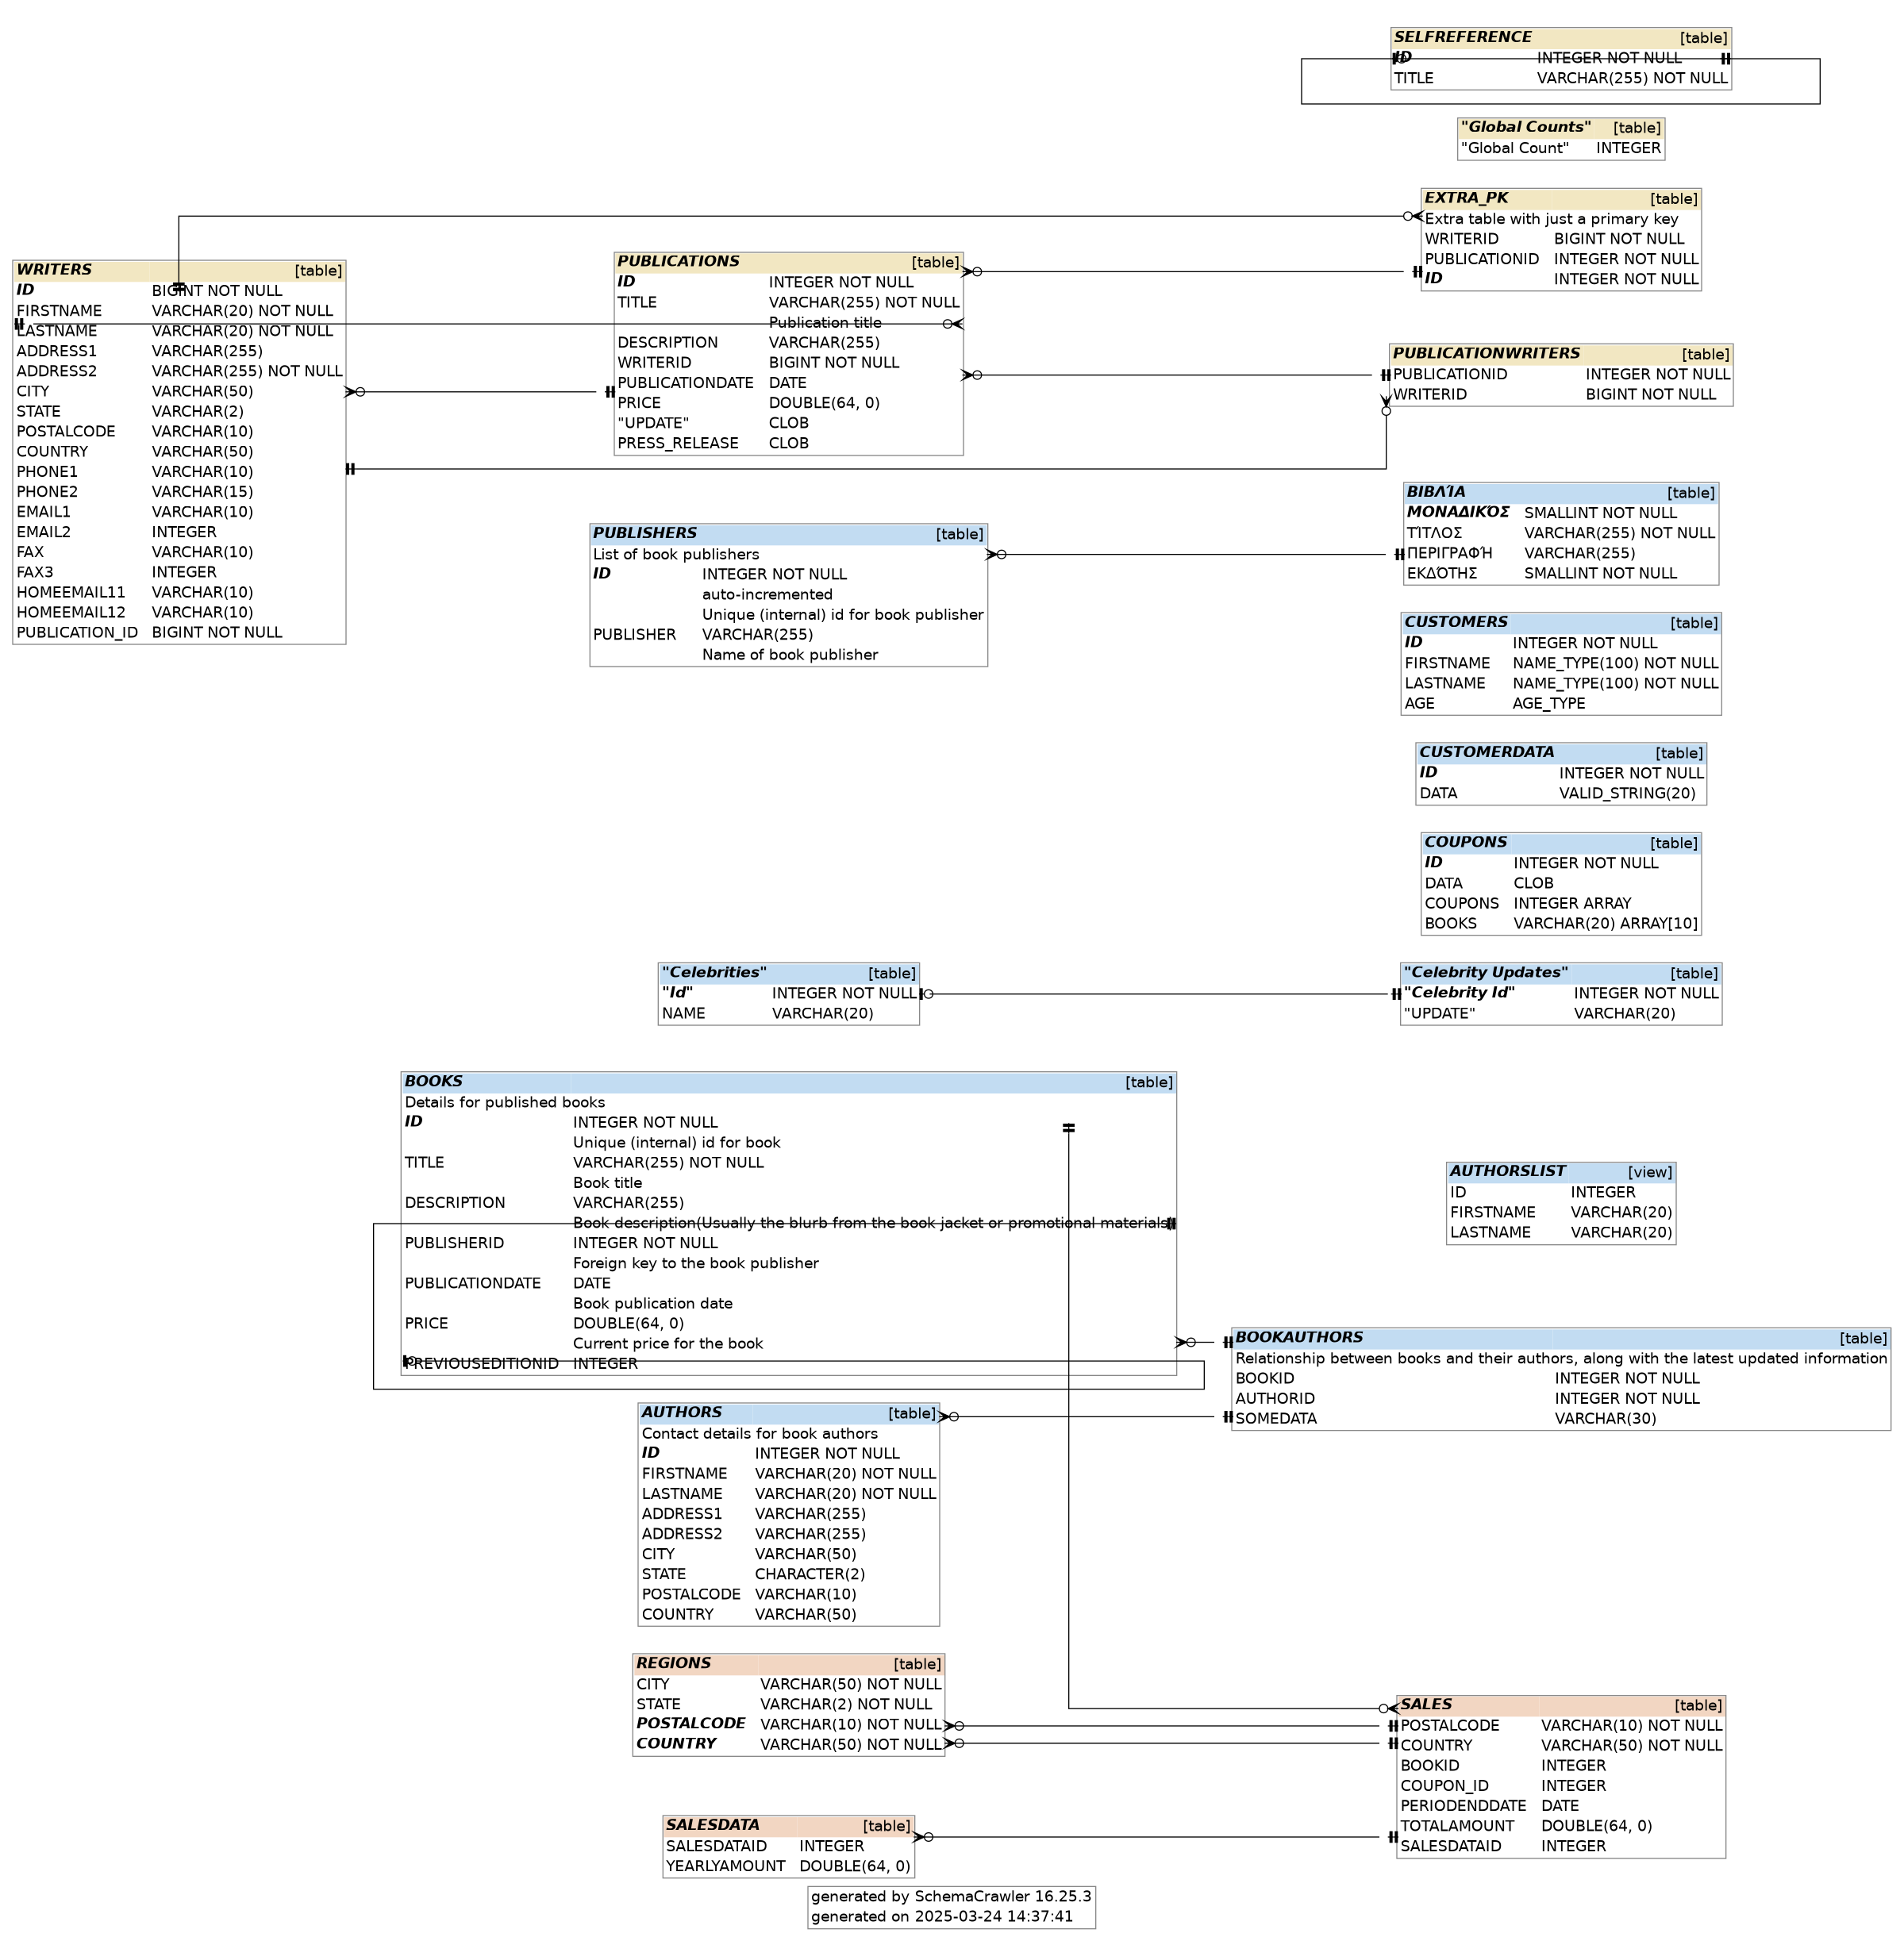
- Suppress schema names and foreign key names, using the
--portable=namescommand-line option.
- Show only significant columns, such as primary and foreign key columns, and columns that are part of unique indexes. Use the
--info-level=standard --command=briefcommand-line option.

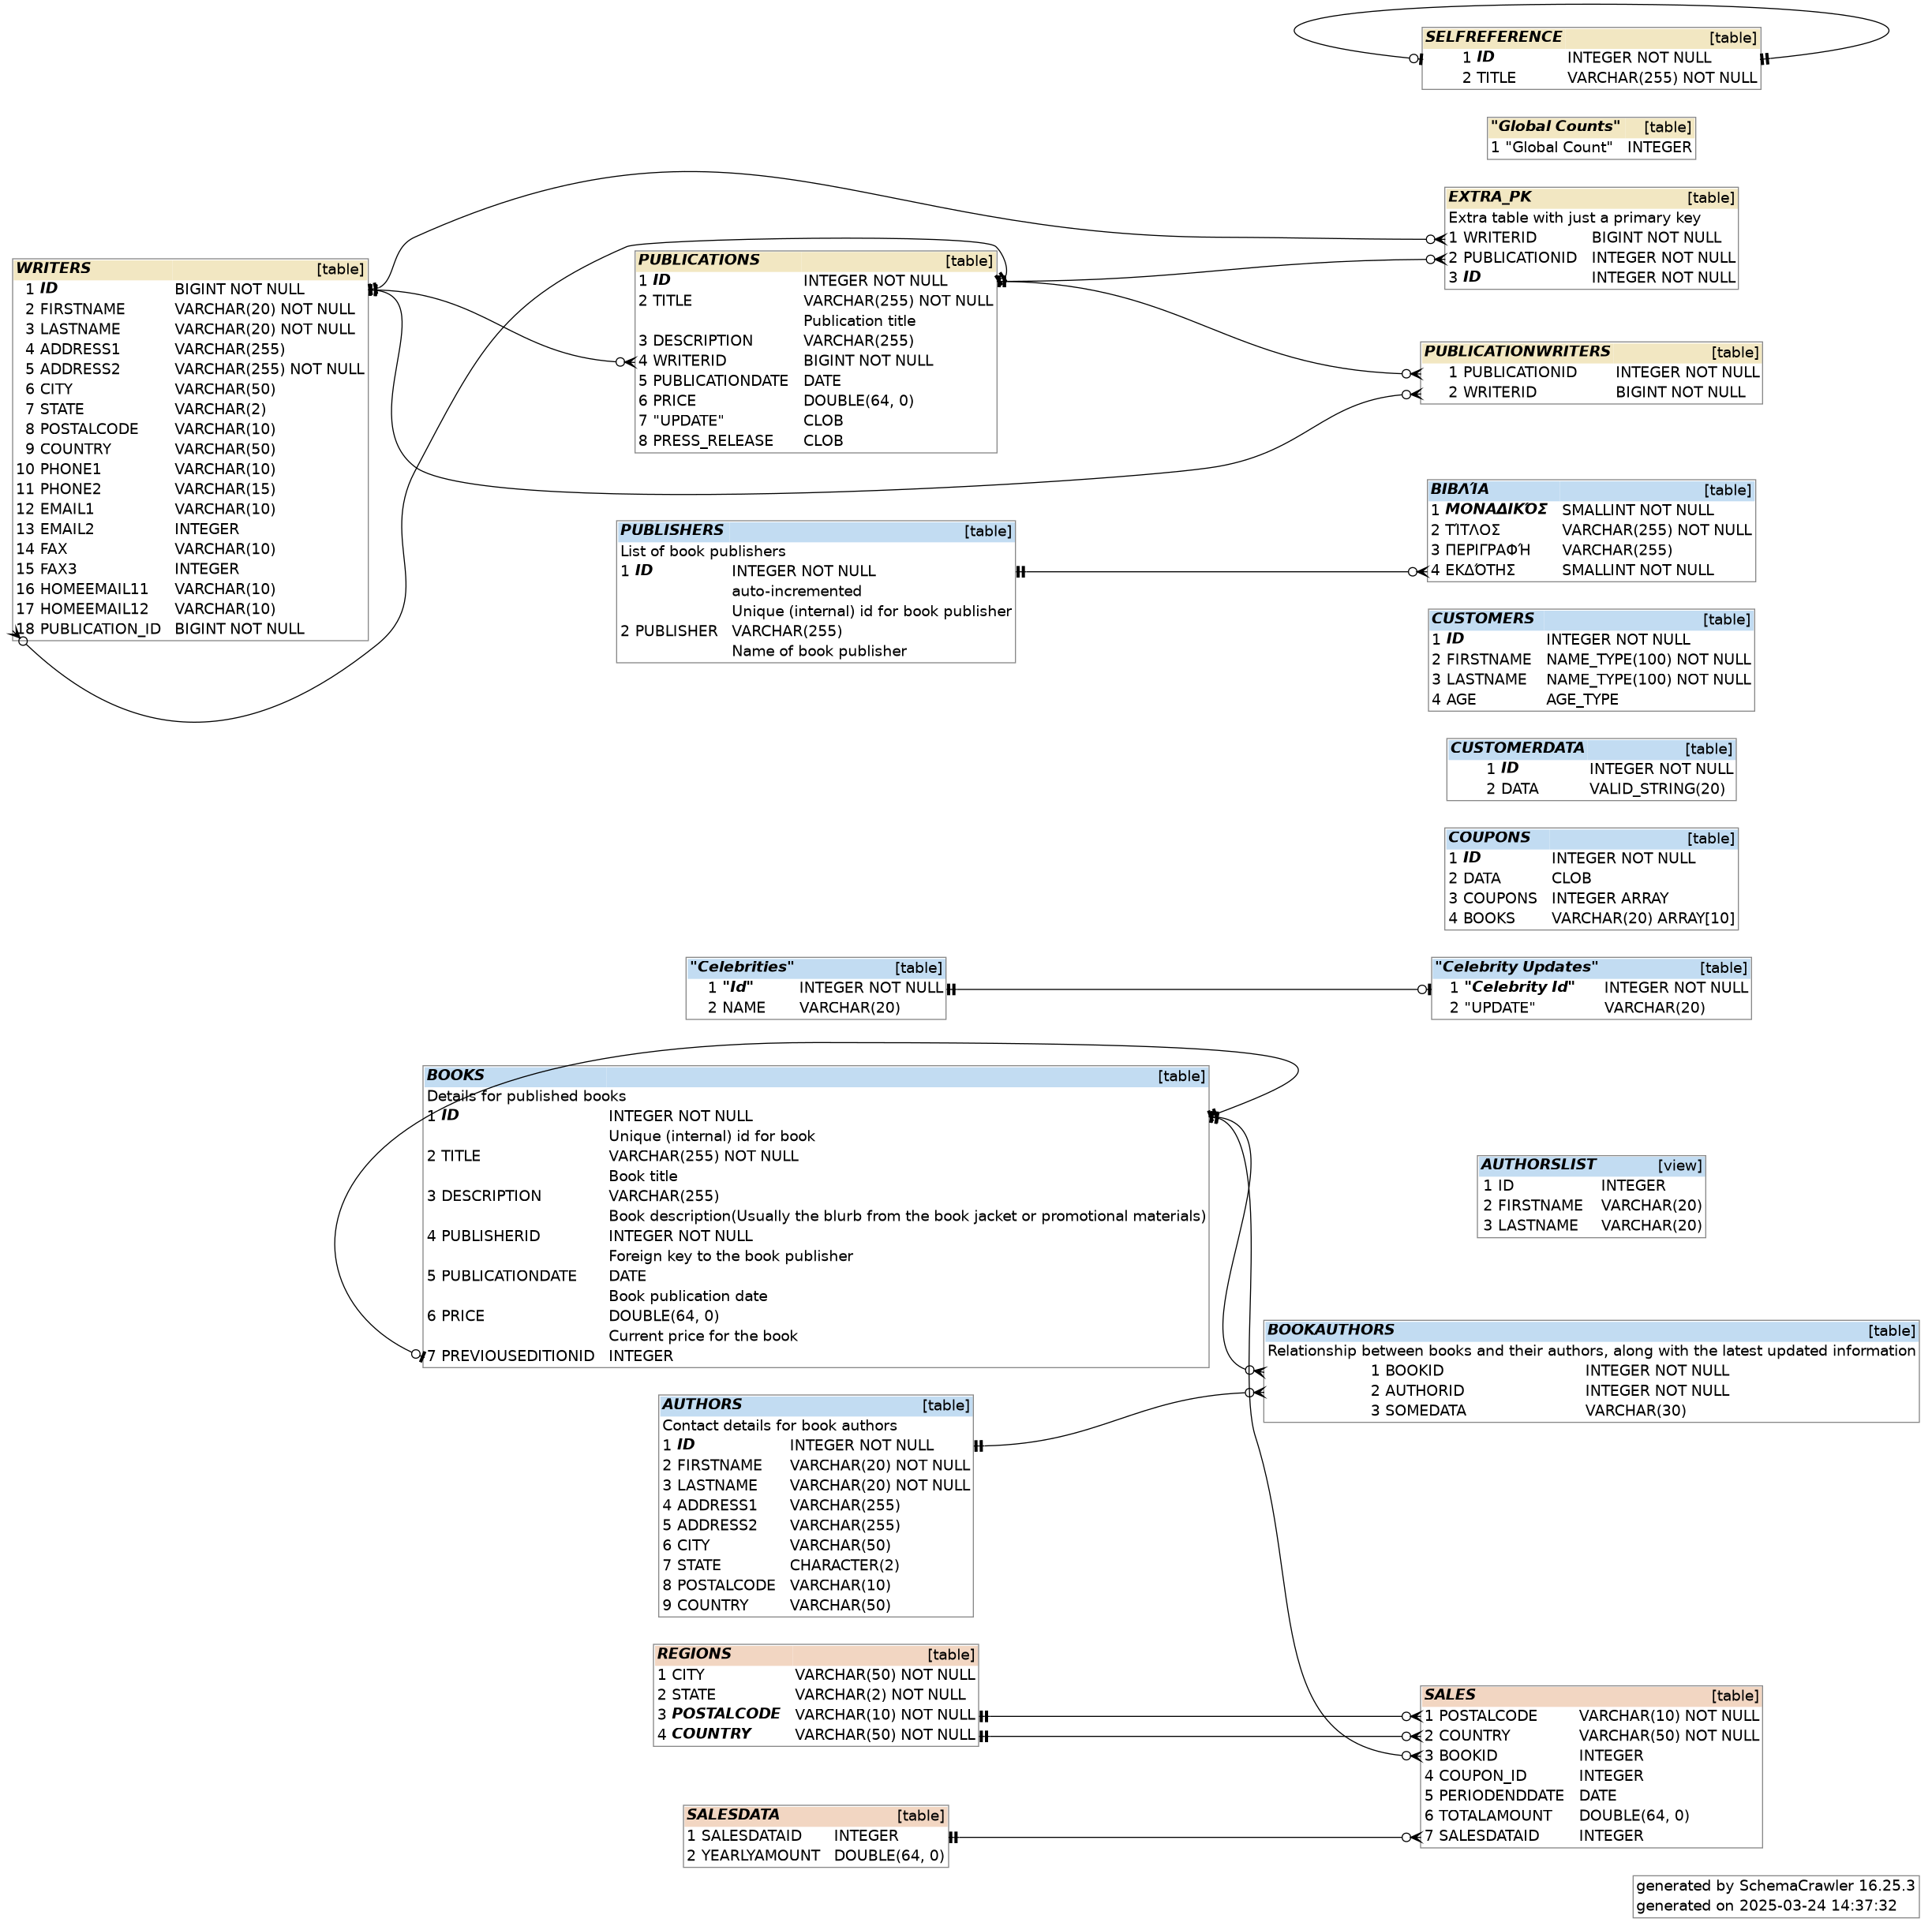
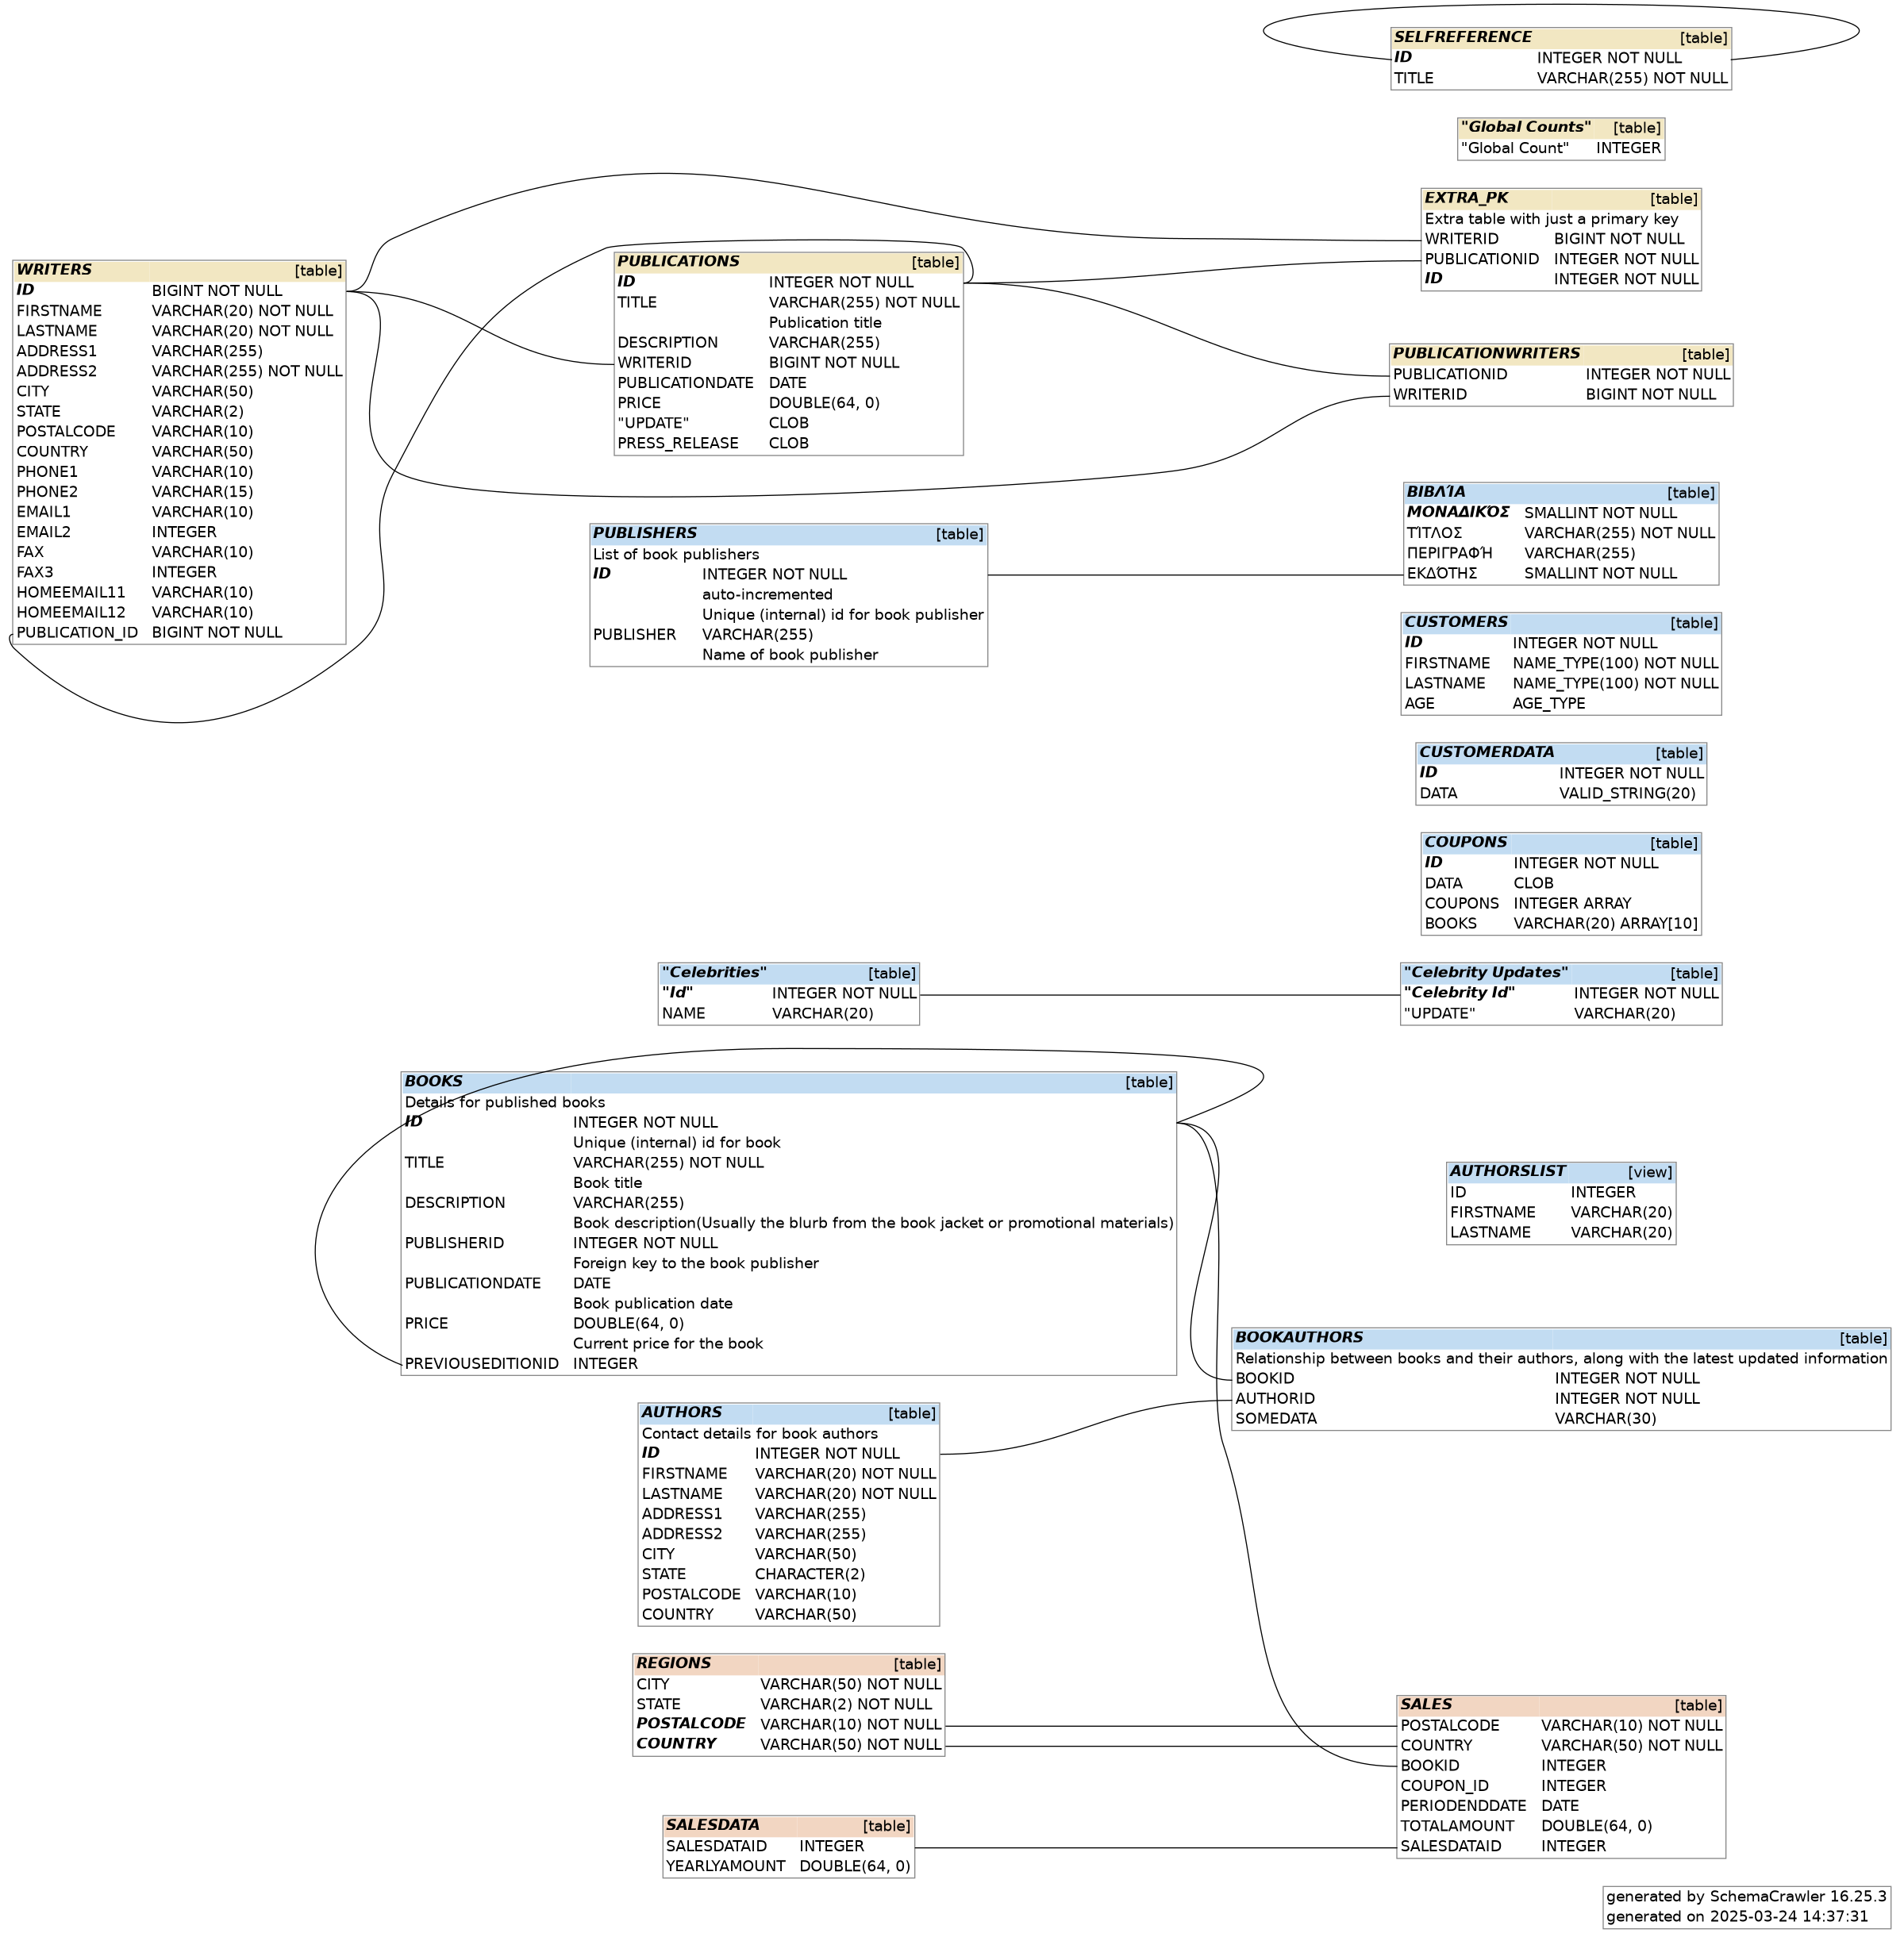
- Show column ordinals, by setting configuration option
schemacrawler.format.show_ordinal_numbers=truein the configuration file.
- Display columns in alphabetical order, using the
--sort-columnscommand-line option.
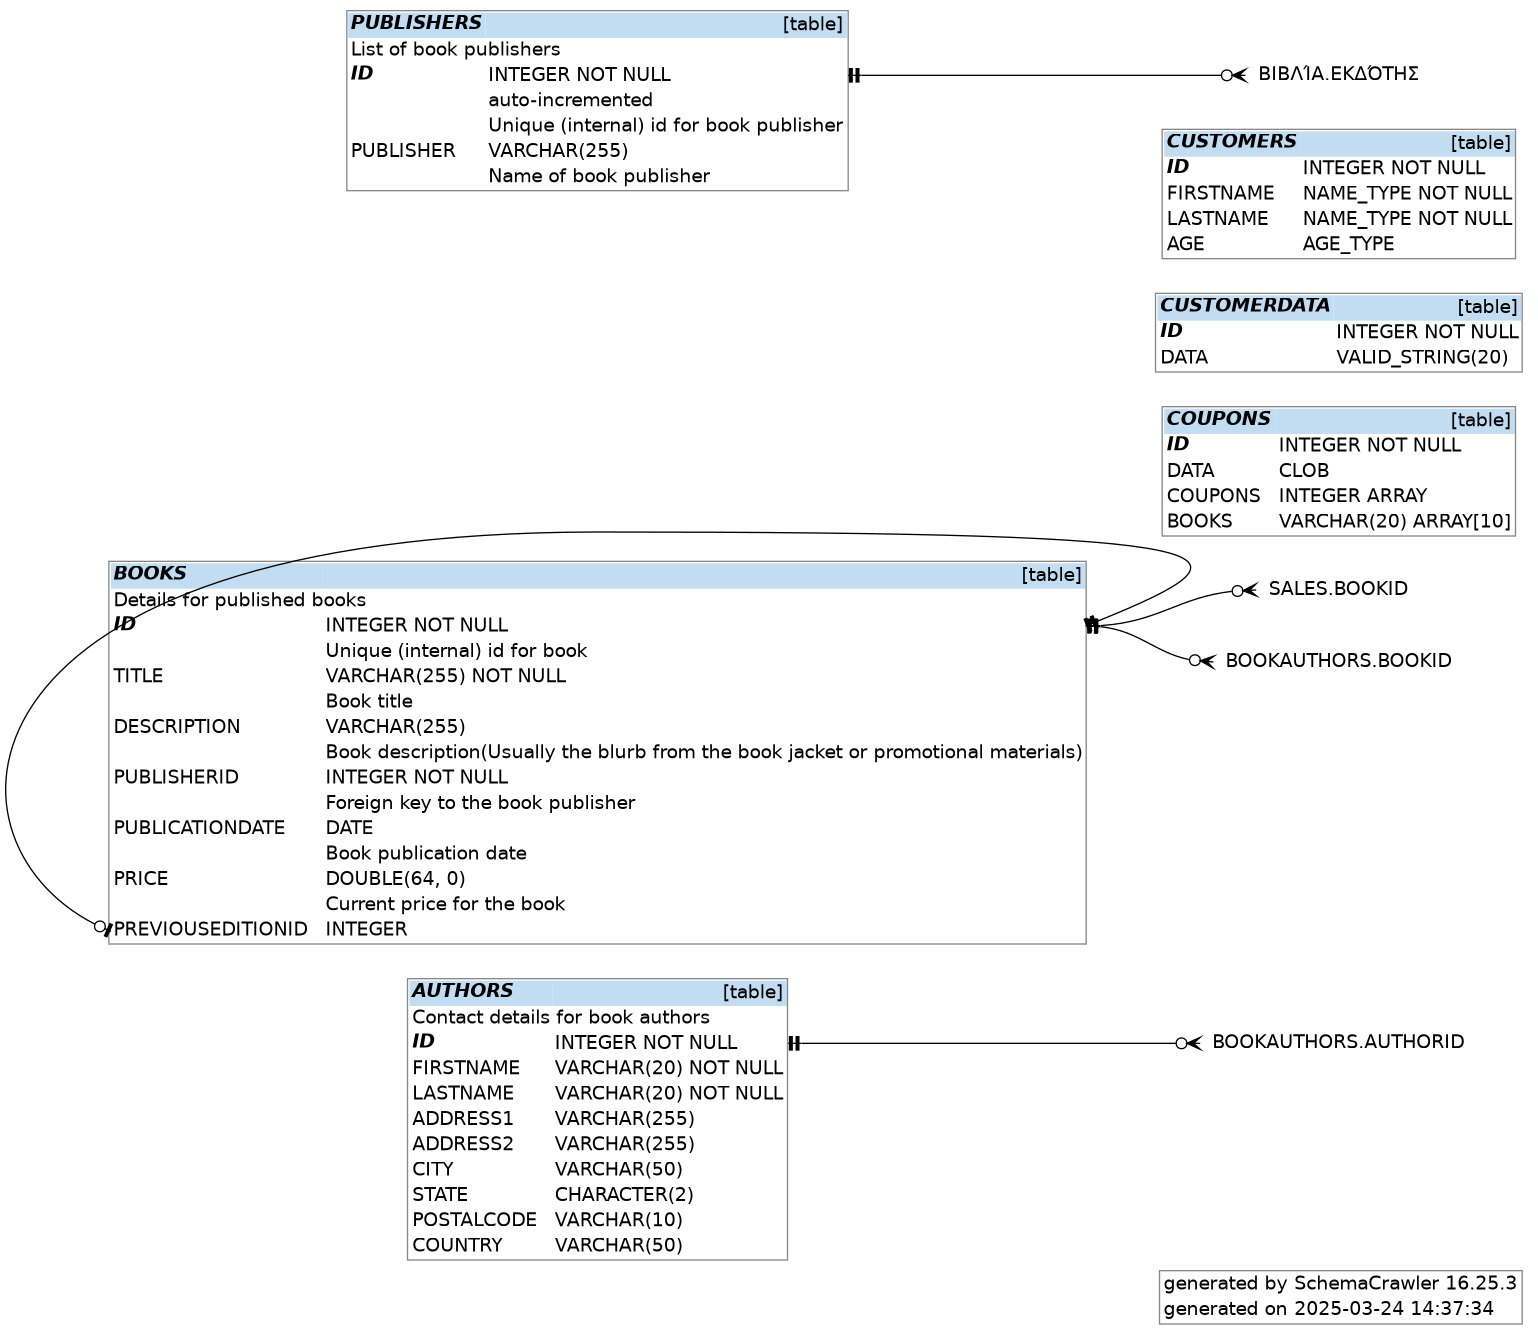
- Grep for columns, and also display outgoing relationships, using
--grep-columns=.*\\.BOOKS\\..*\\.IDas a command-line option.
- Do not show cardinality on the diagrams, to avoid clutter. Set configuration option
schemacrawler.graph.show.primarykey.cardinality=falseandschemacrawler.graph.show.foreignkey.cardinality=falsein the configuration file.
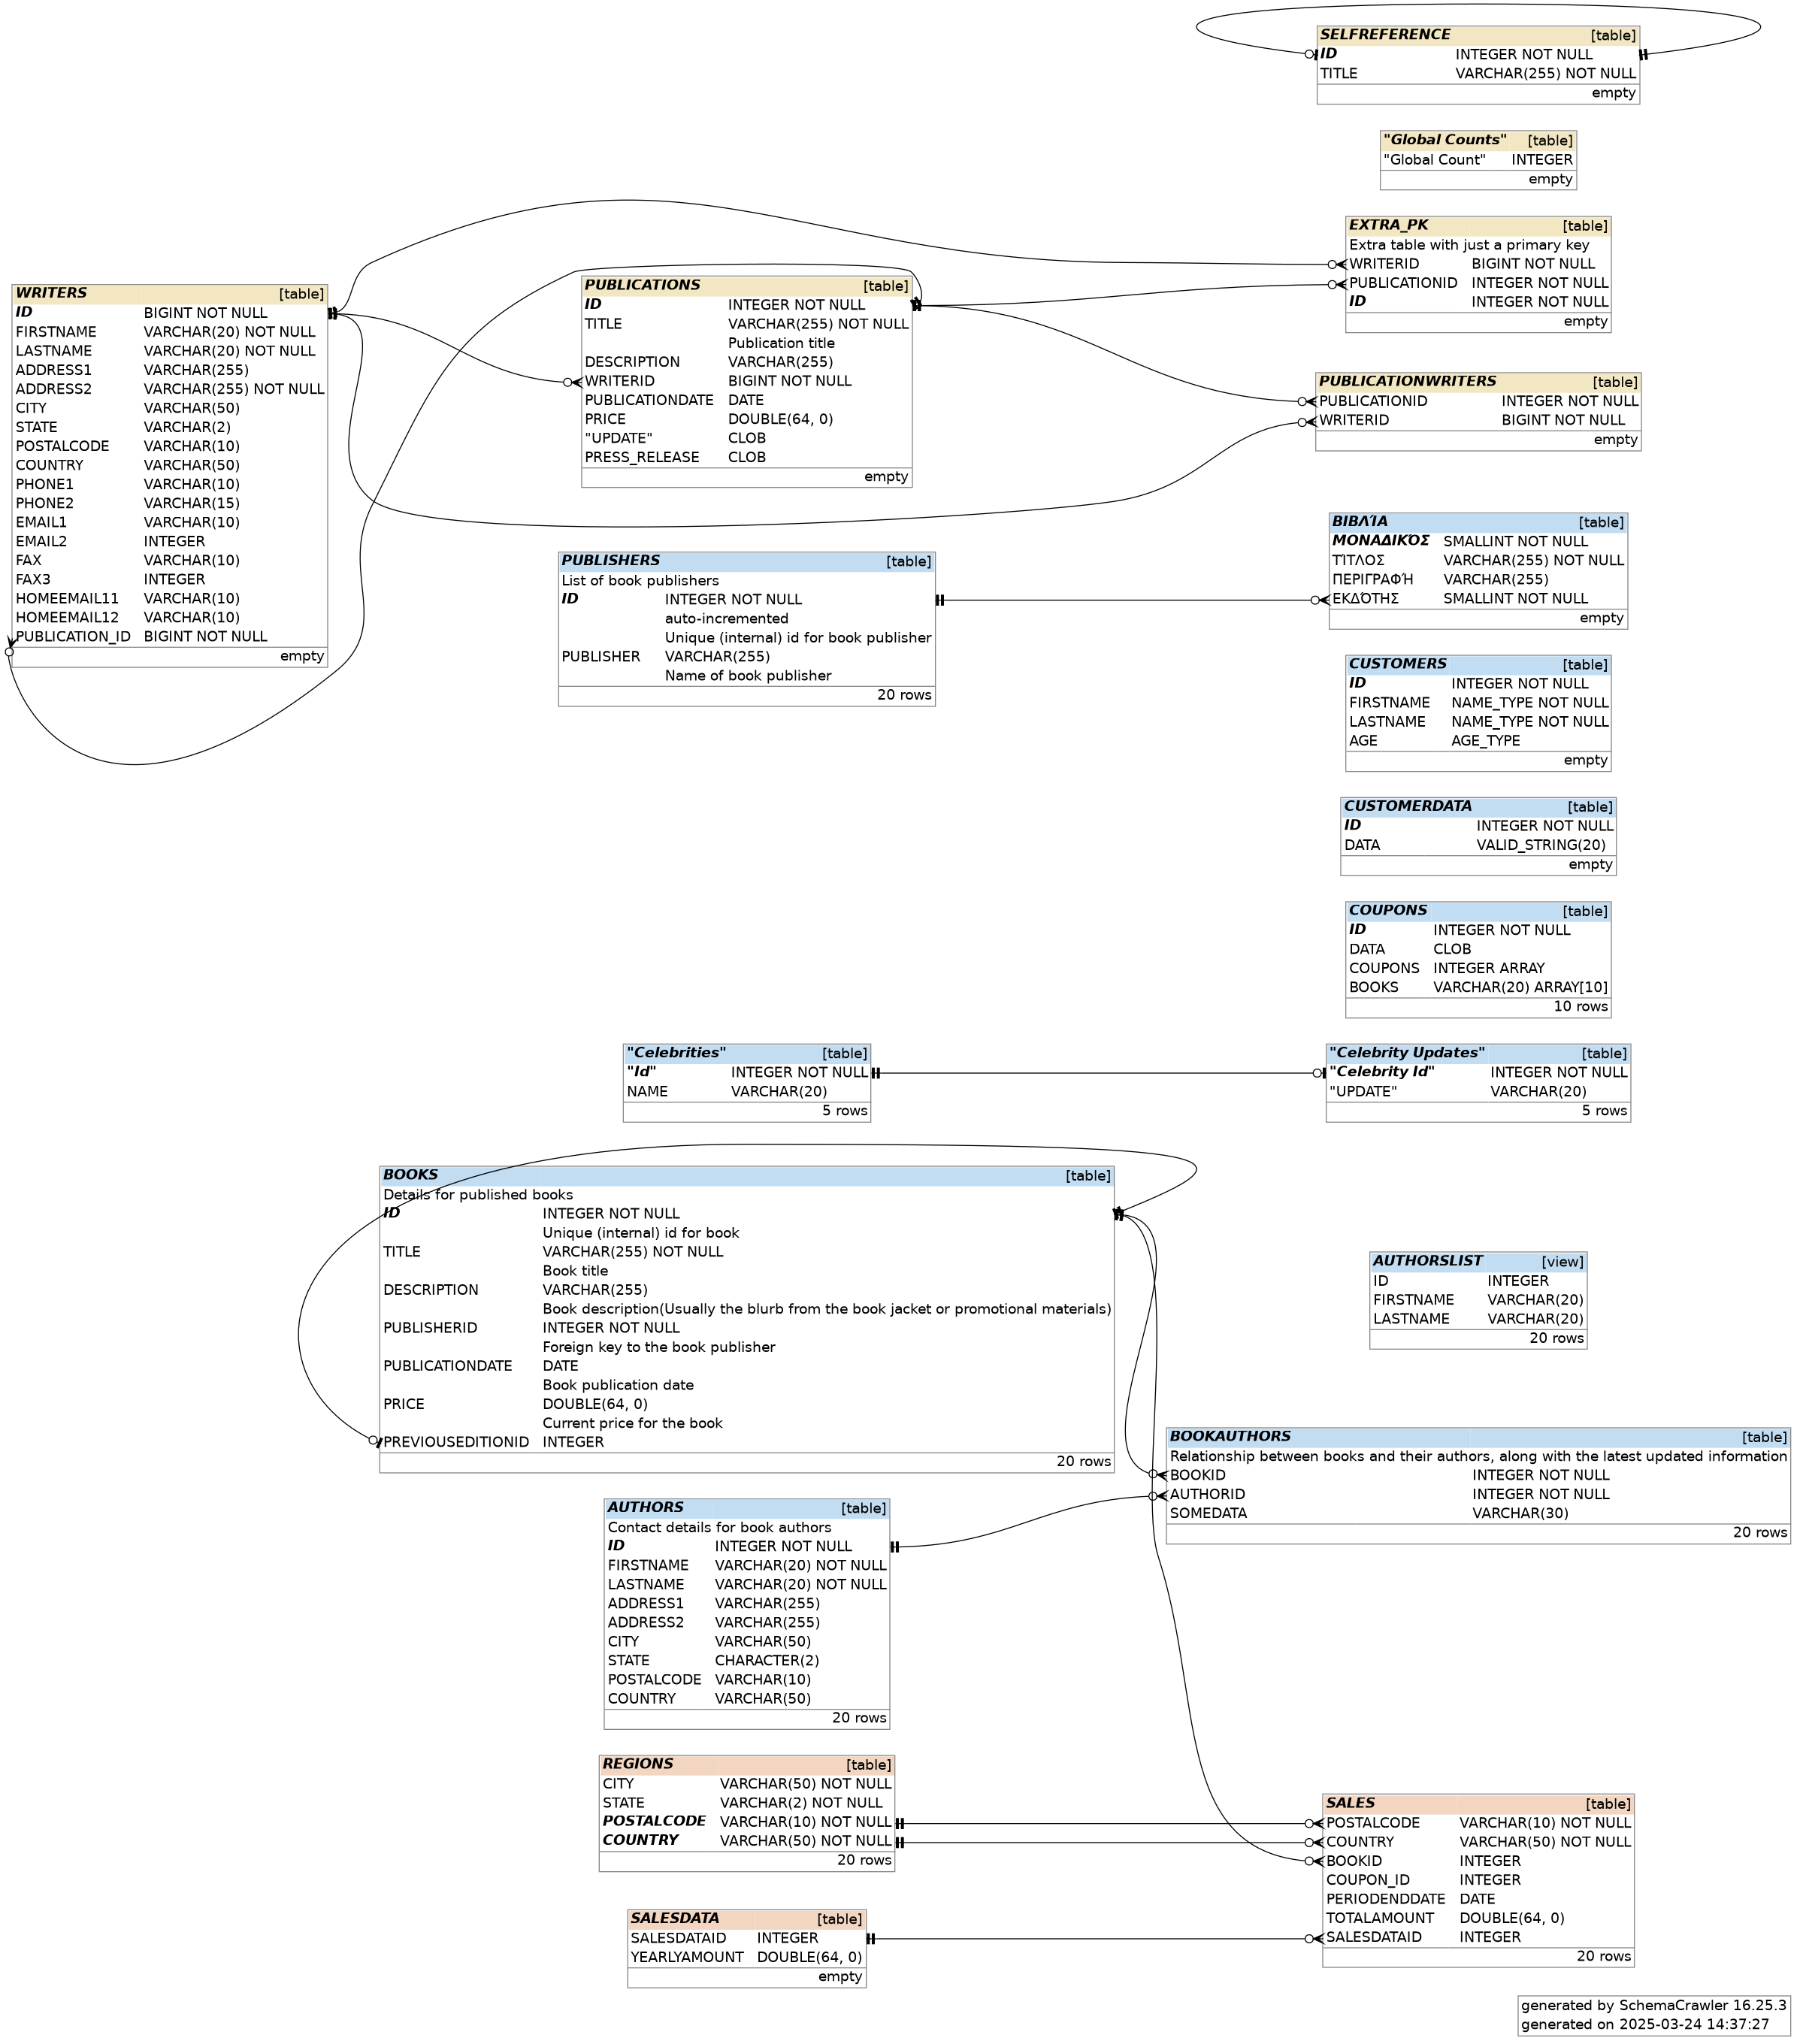
- Show table row counts on the diagrams, run SchemaCrawler with the
--load-row-countscommand-line option.
- Do not show catalog and schema colors on the diagrams, set configuration option
schemacrawler.format.no_schema_colors=truein the configuration file.
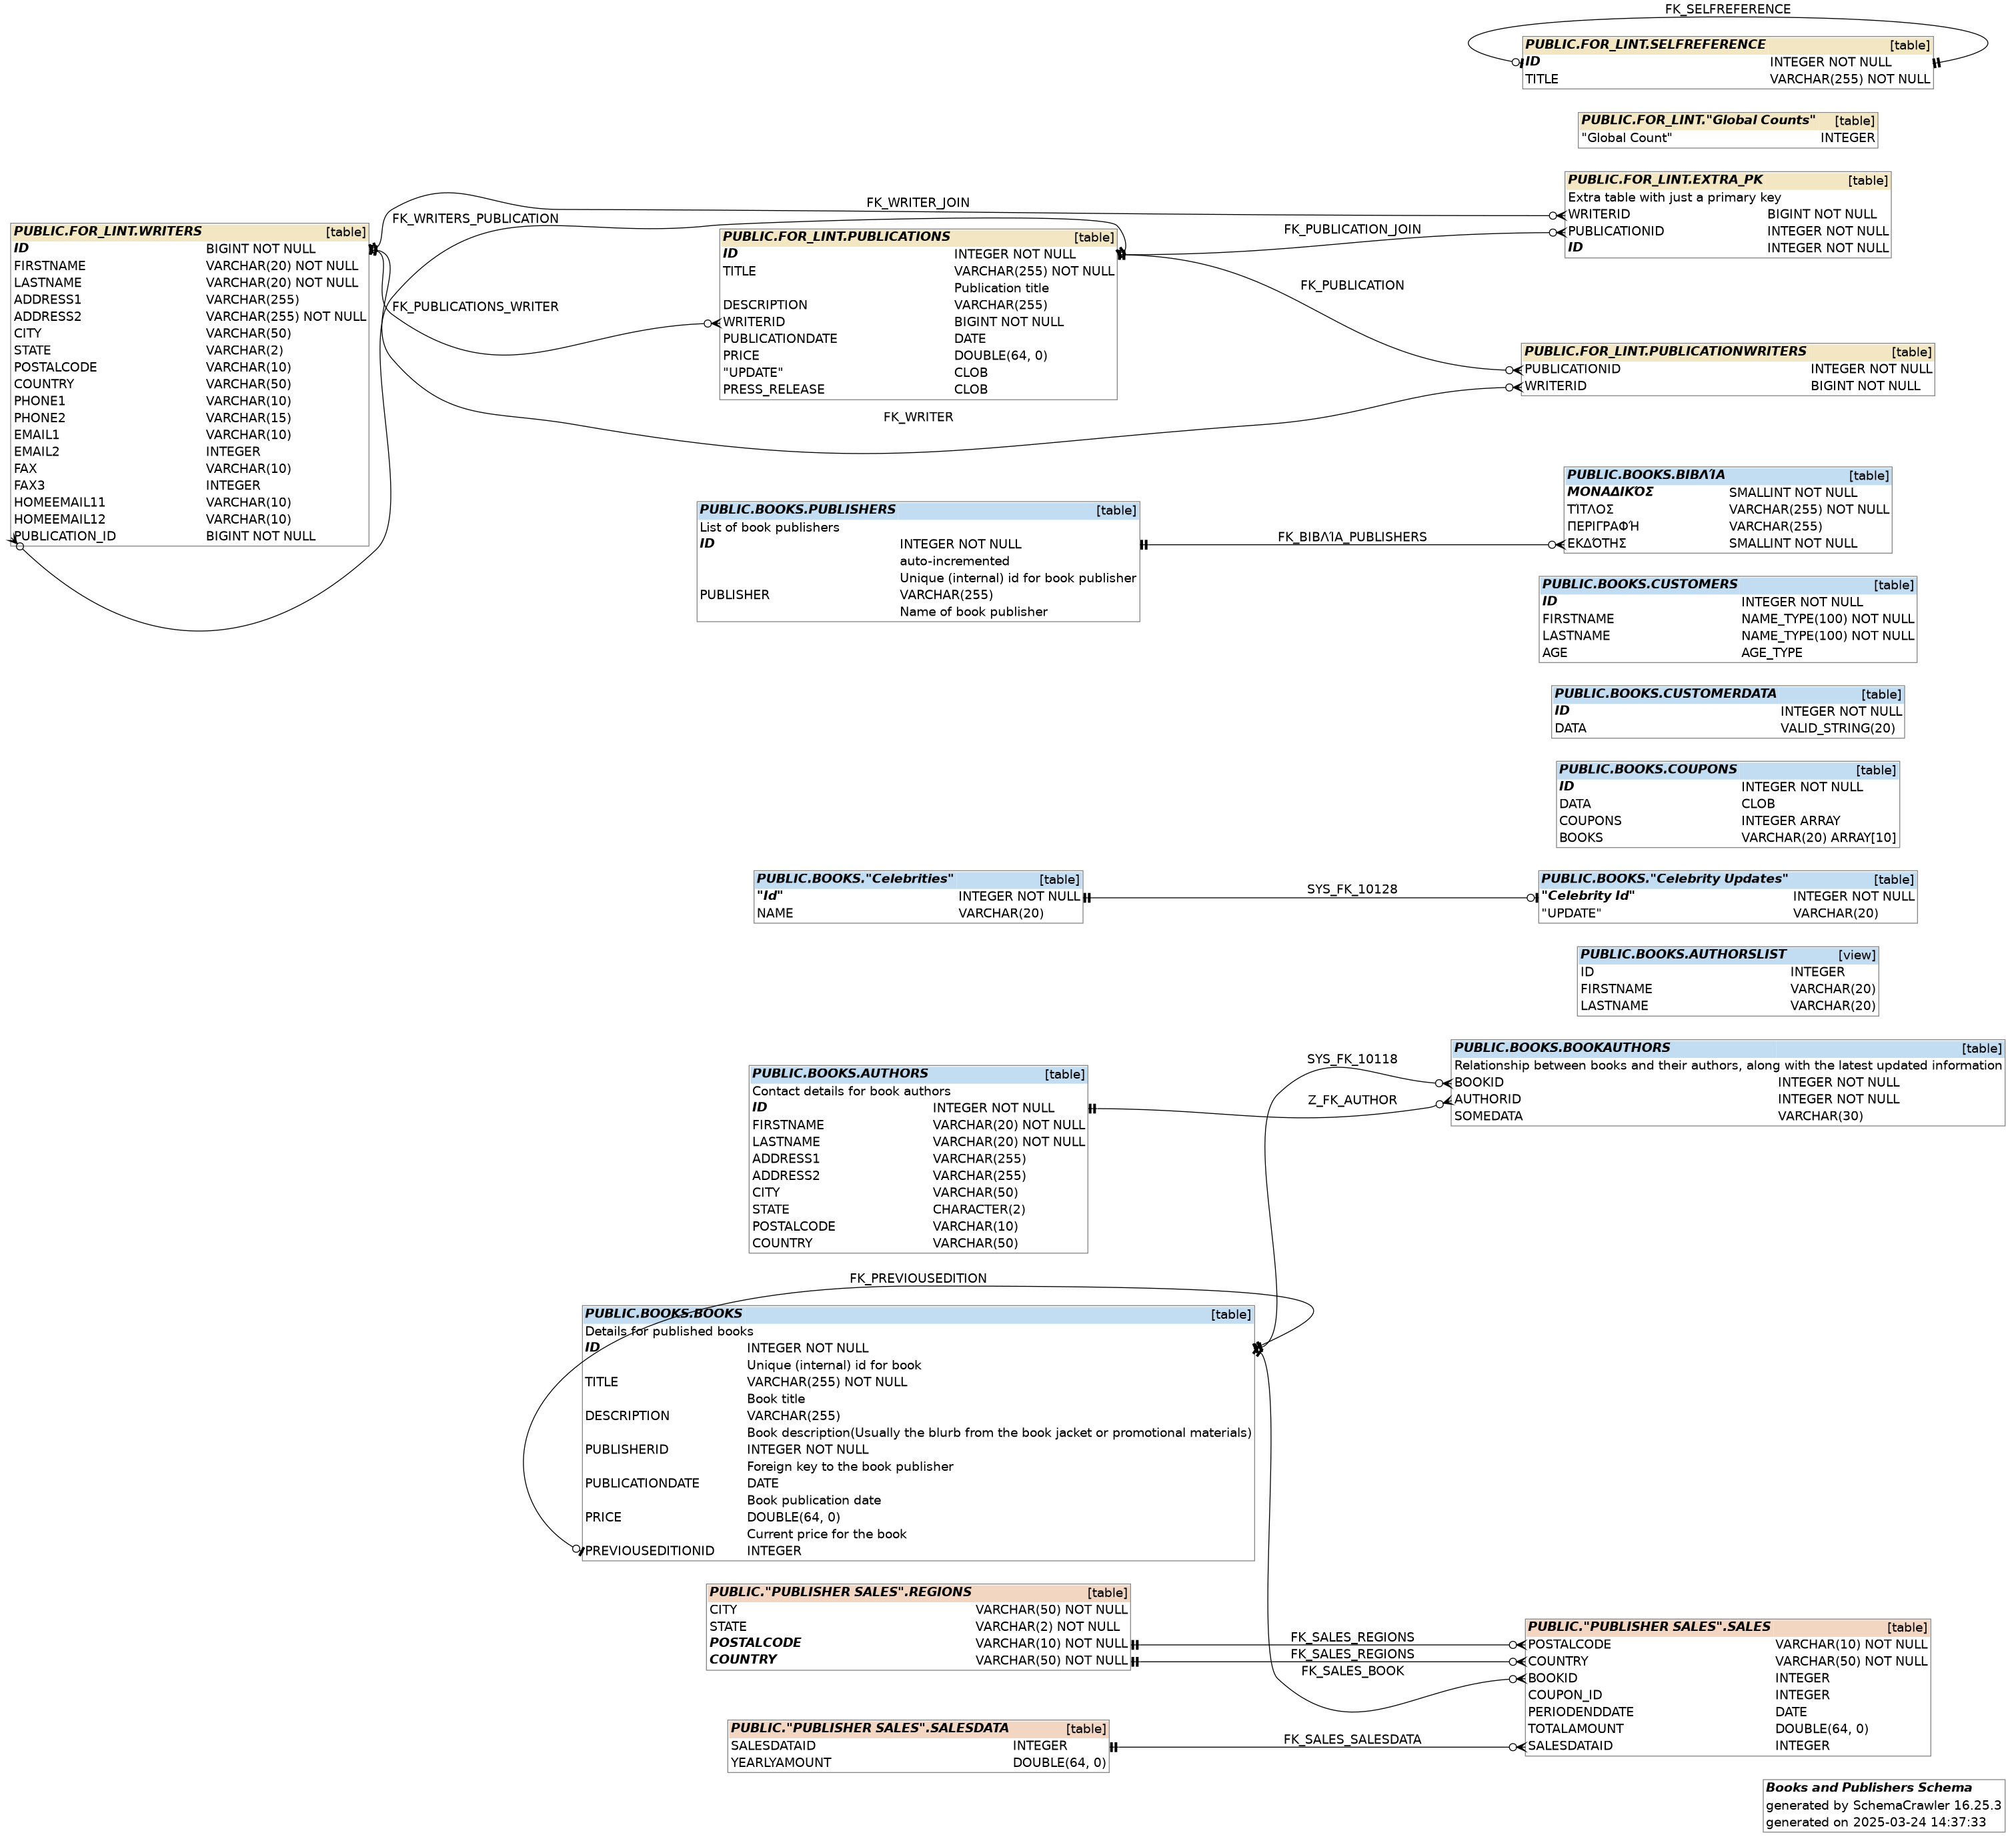
- Show a title on the diagram, use
--title "Books and Publishers Schema"on the command-line.
- Set Graphviz attributes for the graph, node and edge, for example, set configuration option
schemacrawler.graph.graphviz.graph.splines=orthoin the configuration file.
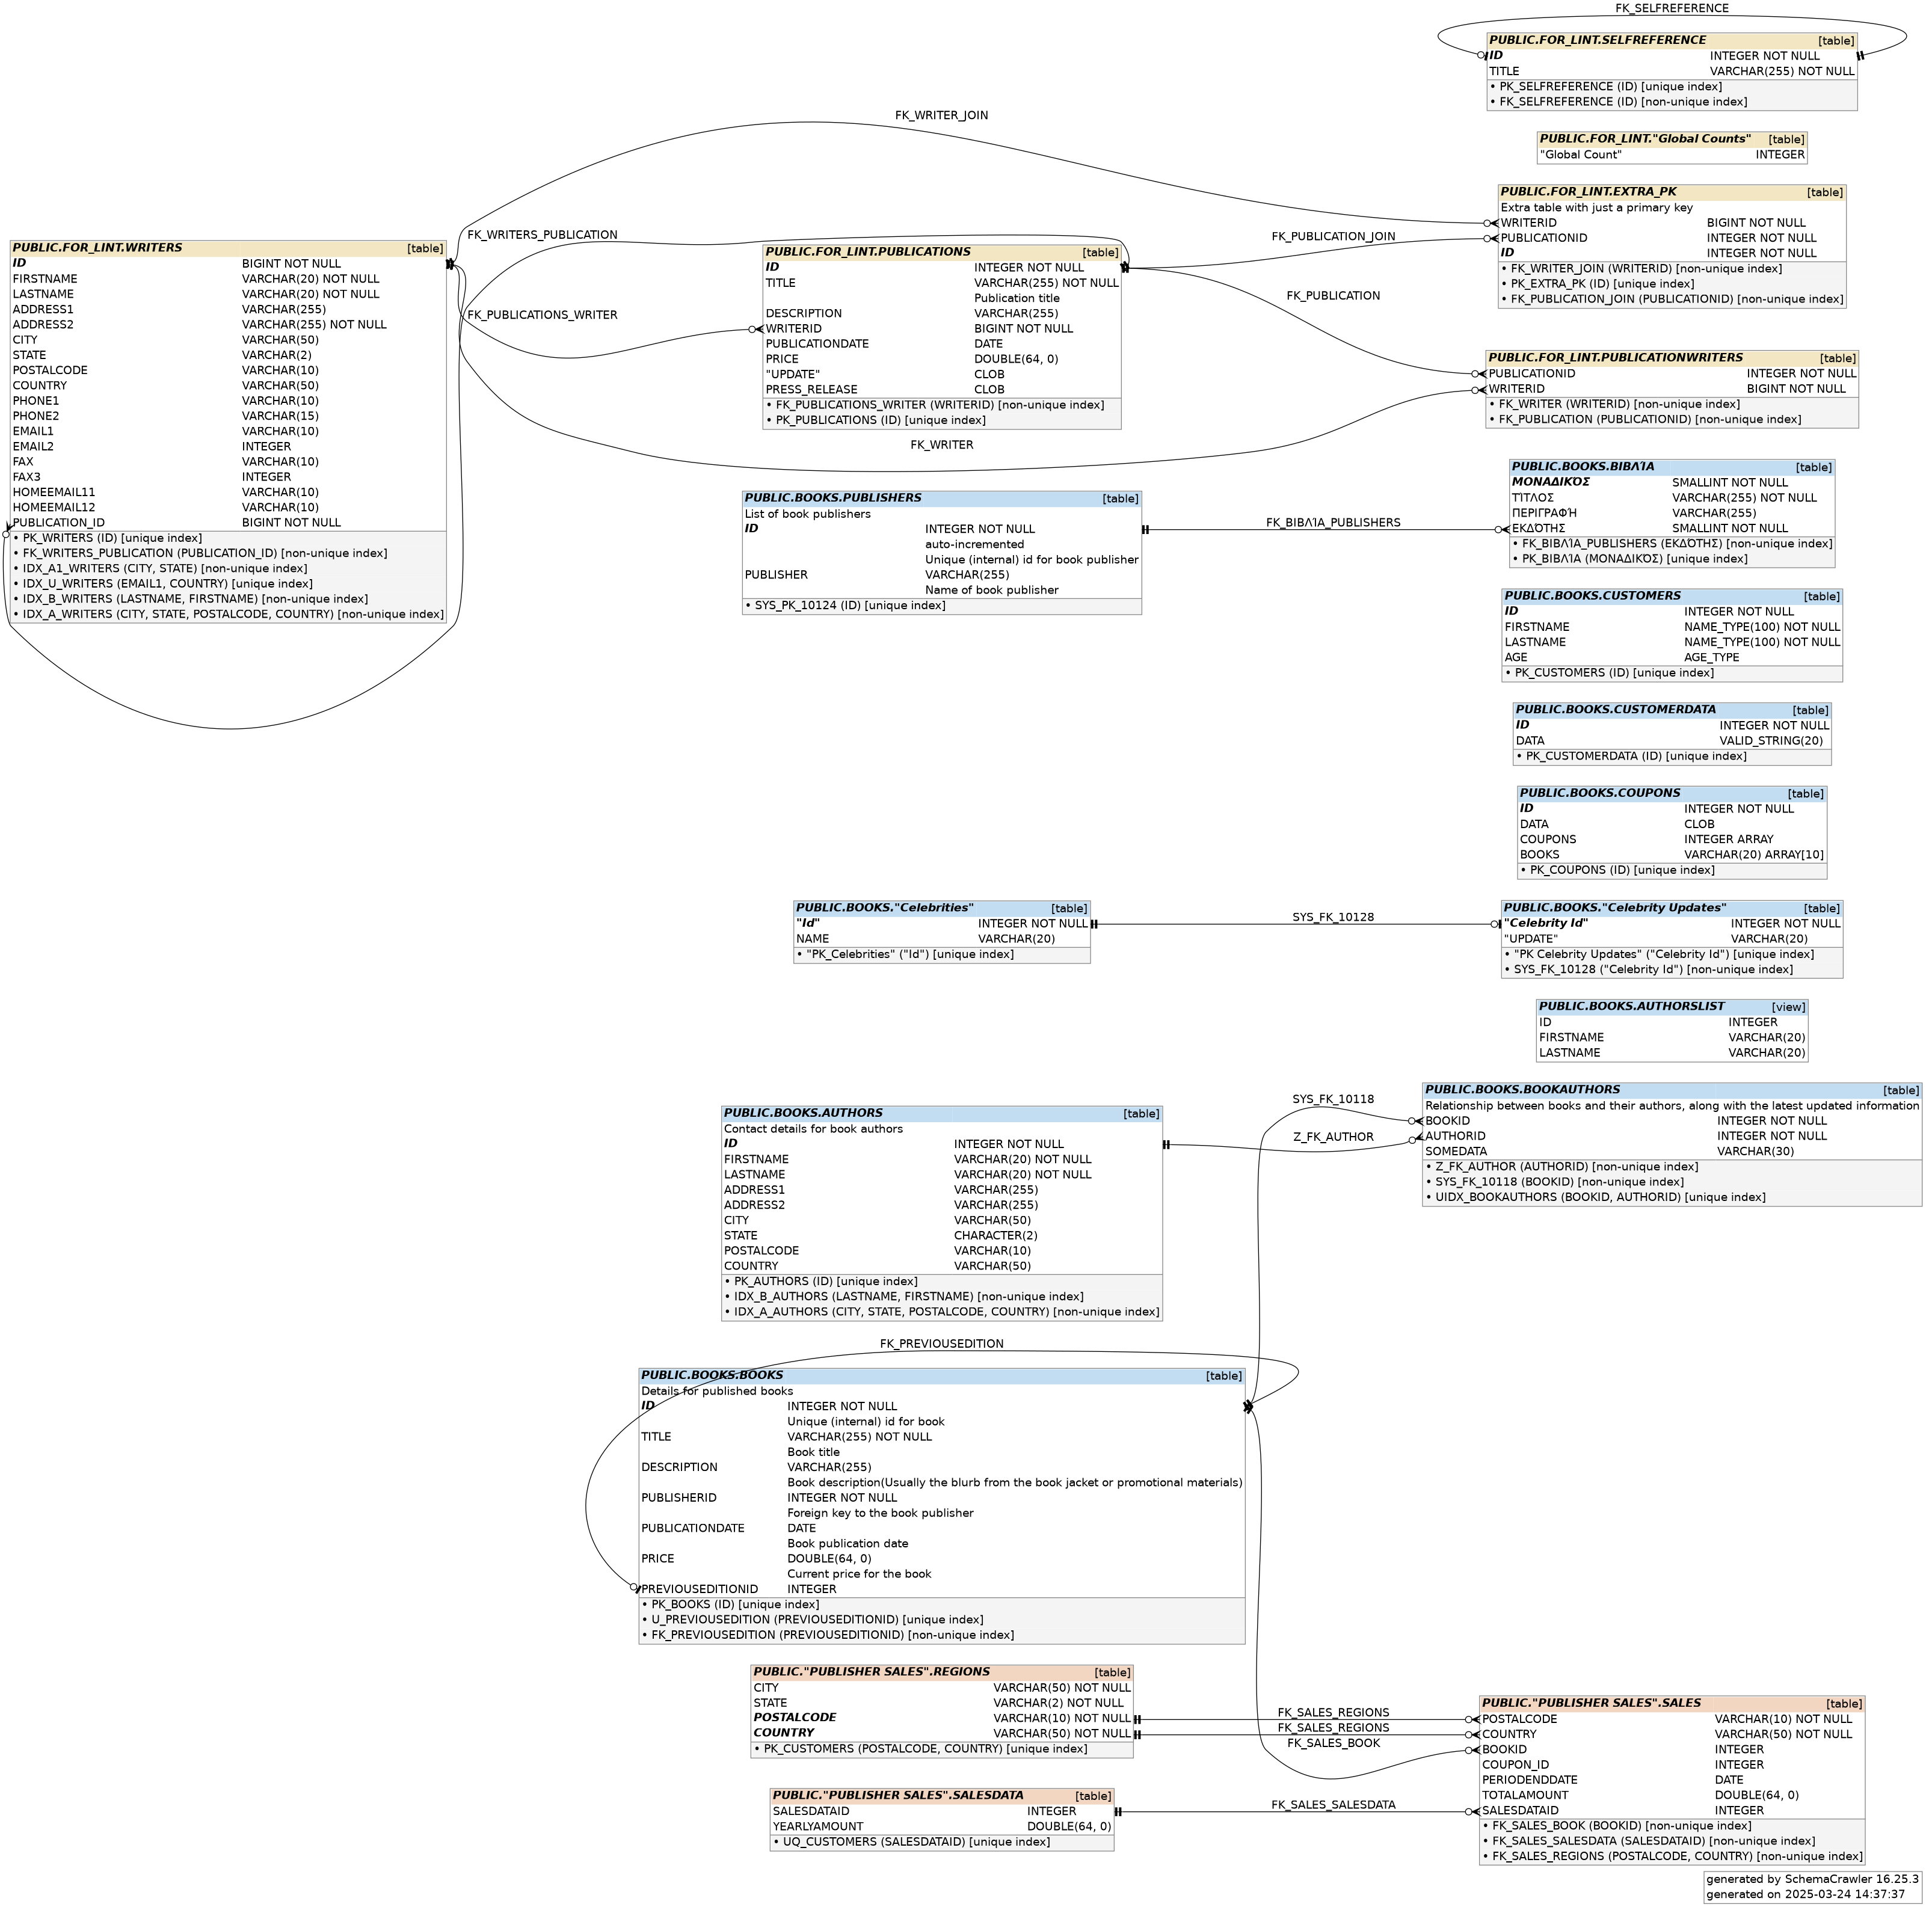
- See indexes on the diagram, use
--command=detailson the command-line.
- See implicit associations in dotted lines on the diagram, use
--implicit-associationson the command-line.
Additional Configuration
Diagram Options
You can decide whether primary key, foreign key and other names, column ordinal numbers, and schema names are displayed by setting the following properties in the SchemaCrawler configuration file, schemacrawler.config.properties.
schemacrawler.format.hide_primarykey_names=false
schemacrawler.format.hide_foreignkey_names=false
schemacrawler.format.hide_weakassociation_names=false
schemacrawler.format.hide_index_names=false
schemacrawler.format.hide_trigger_names=false
schemacrawler.format.hide_routine_specific_names=false
schemacrawler.format.hide_constraint_names=false
Table Row Counts
You can how table row counts on the database diagram by running SchemaCrawler with the --load-row-counts option. You can hide empty tables with an additional --no-empty-tables option.
Graphviz Command-line Options
You can provide additional Graphviz command-line options in one of three ways:
- using the
schemacrawler.graph.graphviz_optsproperty in the SchemaCrawler configuration file, - by passing in the additional arguments using the
SC_GRAPHVIZ_OPTSJava system property, - or by setting the
SC_GRAPHVIZ_OPTSenvironmental variable.
SchemaCrawler does not set the dpi, or resolution of generated graphs. A useful Graphviz command-line option to set is -Gdpi=300. In the SchemaCrawler configuration file, schemacrawler.config.properties, this would look like:
schemacrawler.graph.graphviz_opts=-Gdpi=300
Embedded Diagrams
SchemaCrawler can generate SVG diagrams embedded in HTML output. To generate this format, run SchemaCrawler with an --output-format=htmlx command-line argument. Please edit the SchemaCrawler configuration file, schemacrawler.config.properties, and comment out or delete the line schemacrawler.graph.graphviz_opts=-Gdpi=300.
Tips
- Adobe Acrobat Reader sometimes cannot render PDF files generated by GraphViz. In this case, please use another PDF viewer, such as Foxit.
- To set GraphViz command-line options, edit the SchemaCrawler configuration file,
schemacrawler.config.properties, and edit the line withschemacrawler.graph.graphviz_opts.
Mermaid Diagrams
SchemaCrawler can generate Mermaid Entity Relationship Diagrams for your database. Run SchemaCrawler with a command similar to:
schemacrawler \
--server sqlite \
--database sc.db \
--info-level standard \
--command template \
--templating-language velocity \
--template mermaid.vm \
--output-file sc.mmd
(If you are using Windows PowerShell, replace the backslashes "" with back-ticks “`”.) Generate a diagram by pasting the contents of “sc.mmd” into mermaid.live. The Apache Velocity templates can be modified by providing a path to the modified copy.
PlantUML Diagrams
SchemaCrawler can generate PlantUML diagrams for your database. Run SchemaCrawler with a command similar to:
schemacrawler \
--server sqlite \
--database sc.db \
--info-level standard \
--command template \
--templating-language velocity \
--template plantuml.vm \
--output-file sc.puml
(If you are using Windows PowerShell, replace the backslashes "" with back-ticks “`”.) Generate a diagram by pasting the contents of “sc.puml” into PlantText. The Apache Velocity templates can be modified by providing a path to the modified copy.
dbdiagram.io Diagrams
SchemaCrawler can generate dbdiagram.io diagrams for your database. Run SchemaCrawler with a command similar to:
schemacrawler \
--server sqlite \
--database sc.db \
--info-level standard \
--command template \
--templating-language velocity \
--template dbml.vm \
--output-file sc.dbml
(If you are using Windows PowerShell, replace the backslashes "" with back-ticks “`”.) Generate a diagram by pasting the contents of “sc.dbml” into dbdiagram.io. The Apache Velocity templates can be modified by providing a path to the modified copy.
QuickDBD Diagrams
SchemaCrawler can generate QuickDBD diagrams for your database. Run SchemaCrawler with a command similar to:
schemacrawler \
--server sqlite \
--database sc.db \
--info-level standard \
--command template \
--templating-language velocity \
--template quickdbd.vm \
--output-file sc.quickdbd
(If you are using Windows PowerShell, replace the backslashes "" with back-ticks “`”.) Generate a diagram by pasting the contents of “sc.quickdbd” into QuickDBD. The Apache Velocity templates can be modified by providing a path to the modified copy.
Diagrams Generated From Python Scripts
SchemaCrawler provides Python scripts that can generate these same diagrams. Running Python requires GraalVM, which is provided in the SchemaCrawler Docker image. You can use the Python scripts as shown in the example below. The Python scripts can be modified by providing a path to the modified copy.
docker run \
--mount type=bind,source="$(pwd)",target=/home/schcrwlr/share \
--rm -it \
schemacrawler/schemacrawler \
/opt/schemacrawler/bin/schemacrawler.sh \
--server sqlite \
--database sc.db \
--info-level standard \
--command script \
--script-language python \
--script mermaid.py \
--output-file share/sc.mmd
(If you are using Windows PowerShell, replace the backslashes "" with back-ticks “`”.)
User Contributed Diagram Scripts
You can completely customize how your diagram will look by writing your own script. It is easier to write your own script in a programming language of your choice. You can start with some of the user-contributed scripts below. To use your own script, use a command like the one above, but provide a full path to your script with the --script option, and of course set the --script-language to the right one.
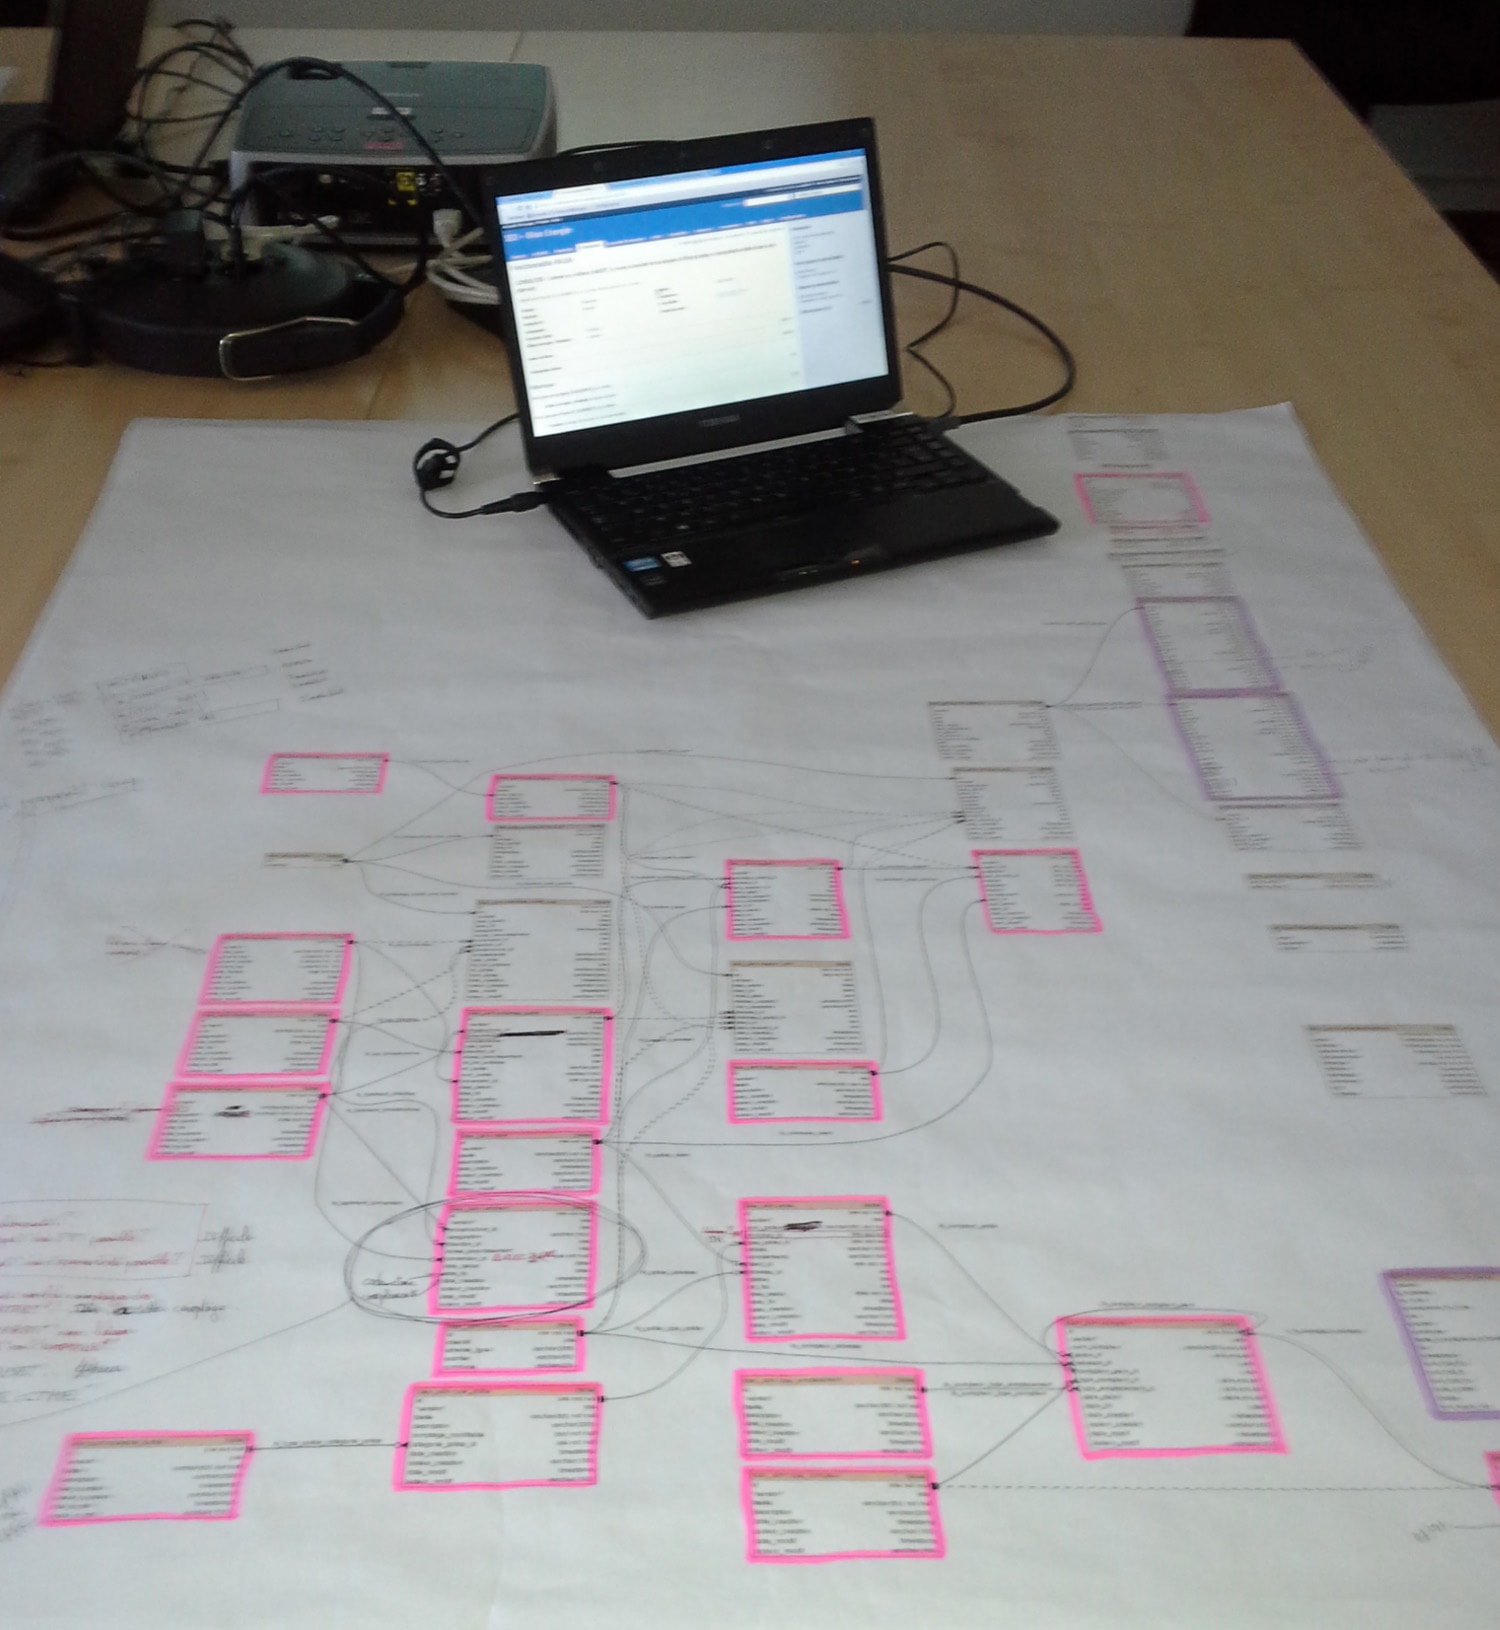
SchemaCrawler Diagrams in Use
Schemacrawler database diagrams in use at the Scrum meeting at the Software Development Departement of La Ville de Nouméa. Photograph courtesy of Adrien Sales.